Processes are a very familiar concept, and we have probably heard of process context switching overhead. So let’s think about a question today, just how much CPU time is consumed by a process context switch? As threads are said to be lighter than processes, will their context switches save much CPU time than process switches? With these questions in mind, let’s get to the point.
1. Processes and process switching
Processes are one of the great inventions of operating systems, shielding applications from hardware details such as CPU scheduling and memory management, and abstracting the concept of a process so that applications can concentrate on implementing their own business logic and perform many tasks “simultaneously” on a limited CPU. But while it brings convenience to the user, it also introduces some additional overhead. In the figure below, the CPU is busy during the middle of the process, but no user work is done, which is the extra overhead of the process mechanism.
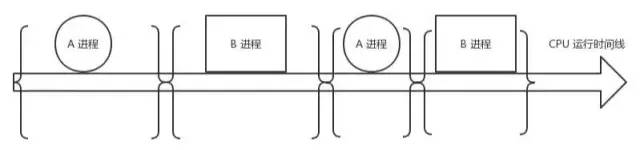
During the switch from process A to process B, the context of process A is first saved so that when A resumes running, it will know what the next instruction of process A is. Then the context of process B, which is going to run, is restored to the register. This process is called context switching. Context switch overhead is not a big problem in application scenarios where there are not many processes and the switch is not frequent. But now Linux operating systems are used as back-end servers for highly concurrent web programs. When supporting thousands of user requests on a single machine, this overhead needs to be taken out of the equation. This is because user processes can trigger context switches when they request Redis, Mysql data, and other network IO blocking off, or when the process time slice arrives.
2. A simple process switching overhead test
Without further ado, let’s test how long a context switch takes in terms of CPU time with an experiment! The experiment is done by creating two processes and passing a token between them. One of the processes will cause blocking when reading the token. The other process sends the token and waits for it to return while also blocking.Transfer them back and forth a certain number of times, and then count their average single switchover time overhead.
Compile and run.
The execution time varies from time to time, and the average time per context switch is about 3.5us after several runs. Of course, this number varies from machine to machine and it is recommended to test it on a real computer.
When we tested the system call earlier, the lowest value was 200 ns, which shows that the context switching overhead is higher than the system call overhead. The system call only switches the user state to the kernel state and back within the process, while the context switch switches directly from process A to process B. Obviously this context switch requires more work to complete.
3. Process switching overhead analysis
What are the specific CPU overheads when context switching? There are two kinds of overheads, one is direct overhead and the other is indirect overhead.
The direct overhead is what the cpu must do when switching, including.
-
switch page table global directory
-
switch the kernel state stack
-
switch hardware context (before the process resumes, the data that must be loaded into registers is collectively referred to as the hardware context)
- ip(instruction pointer): point to the next instruction of the current execution instruction
- bp(base pointer): used to store the bottom address of the stack frame corresponding to the function being executed
- sp(stack poinger): used to store the top address of the stack frame corresponding to the function being executed
- cr3:page directory base address register, which holds the physical address of the page directory table
- ……
-
Refresh TLB
-
System scheduler code execution direct overhead, a kind of indirect overhead.
Indirect overhead mainly refers to the fact that although after switching to a new process, the speed runs slower because the various caches are not hot. If the process is always scheduled on a CPU is okay, if cross-CPU, the TLB, L1, L2, L3 that were previously hot up because the running process has changed, so the code and data cached up by the principle of locality are also useless, resulting in more IO penetrating into memory for the new process. In fact, our experiment above does not measure this situation well, so the actual context switching overhead may be larger than 3.5us.
4. A more professional testing tool - lmbench
lmbench is a multi-platform open source benchmark for evaluating the overall performance of the system, and can test performance including document reading and writing, memory operations, process creation and destruction overhead, network and so on. Easy to use, but is running a little slow, you can try it yourself if you are interested.
The advantage of this tool is that is conducted multiple groups of experiments, each group of 2 processes, 8, 16. The size of the data used by each process is also changing, fully simulating the impact caused by cache miss. I used him to measure the results as follows.
|
|
lmbench shows process context switch elapsed time from 2.7us to 5.48.
5. Thread context switching time consuming
We tested the overhead of process context switching earlier, let’s continue testing threads in Linux. Let’s see if it can be faster than a process, and if so, how much faster.
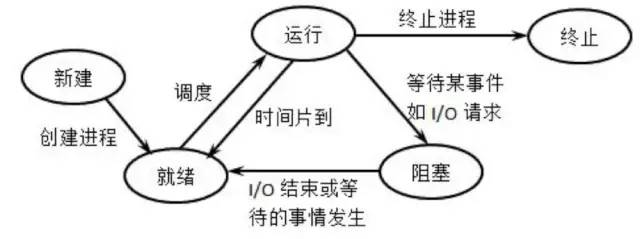
In fact, there are no threads in Linux, but to cater to the developer’s taste, a lightweight process was created and called a thread. The process has its own independent task_struct process descriptor and its own independent pid. from the operating system perspective, there is no difference between the scheduling and the process, both are in the waiting queue of the bidirectional chain table to select a task_struct cut to the running state only. The only difference between lightweight processes and normal processes is that they can share the same memory address space, code segments, global variables, and the same set of open files.
All threads under the same process see the same pid with getpid(), but there is actually a tgid field in task_struct. For multi-threaded programs, the getpid() system call actually gets this tgid, so multiple threads belonging to the same process appear to have the same PID.
We use an experiment to perform another test. The principle is similar to the process test, where 20 threads are created and signals are passed between them through a pipe. When a signal is received, it wakes up, then passes the signal to the next thread and sleeps itself. The extra overhead of signaling the pipeline is considered separately in this experiment and is accounted for in the first step.
The results will vary a bit from experiment to experiment. The above results are averaged after taking multiple results, and the overhead per thread switch is about 3.8us. From the point of view of context switching time consumption, Linux threads (lightweight processes) are actually not very different from processes.
6. Linux-related commands
Now that we know that context switches consume a lot of CPU time, what tools can we use to see how many switches are happening in Linux? If context switching is affecting the overall performance of the system, is there any way to identify the problematic processes and optimize them?
|
|
Or.
|
|
The above environment is a production environment machine, configuration is 8 core 8G KVM virtual machine, the environment is in nginx + fpm, the number of fpm is 1000, the average number of user interface requests processed per second about 100. The cs column indicates the number of context switches that occurred in the system in 1s, and the number of switches reached 4W times in about 1s. A rough estimate, each core needs to switch about 5K times per second, then 1s need to spend nearly 20ms in the context of the switch. Knowing that this is a virtual machine, there will be some additional overhead in virtualization itself, and also really consume CPU in user interface logic processing, system call kernel logic processing, and network connection processing and soft interrupts, so the 20ms overhead is actually not low.
So further, let’s look at which processes are causing the frequent context switches?
Since fpm is in synchronous blocking mode, every time a request to Redis, Memcache, or Mysql blocks causing a voluntary context switch of cswch/s, and only after the time slice arrives does it trigger an involuntary switch of nvcswch/s. It can be seen that most of the switching of fpm processes is voluntary and involuntary is relatively rare.
If you want to see the total context switching of a specific process, you can look directly under the /proc interface, but this is the total value.
7. Conclusion of this article
There is no need to remember what the context switch does, we just need to remember a conclusion. The measured overhead of the author’s development machine context switch is about 2.7-5.48us, your own machine can use the code or tools I provide to do some testing.
The lmbench is relatively more accurate because it takes into account the additional overhead caused by the Cache miss after the switch.