Over the past year, ARMS has built Kubernetes monitoring based on eBPF technology, providing multi-language non-intrusive application performance, system performance, and network performance observation capabilities, validating the effectiveness of eBPF technology. eBPF technology and ecology are developing well, and the future prospects are vast. As a practitioner of this technology, the goal of this paper is to introduce eBPF technology by answering 7 core questions itself, to unravel the eBPF for everyone.
What is eBPF?
eBPF is a technology that enables sandboxed programs to be run in the kernel, providing a mechanism to safely inject code when kernel events and user program events occur, allowing non-kernel developers to take control of the kernel as well. As the kernel has evolved, eBPF has gradually expanded from its initial packet filtering to include networking, kernel, security, tracing, etc. And its functional features are still evolving rapidly. Early BPFs were called classic BPFs, or cBPF for short, and it is this functional expansion that has led to the current BPFs being called extended BPFs, or eBPF for short.
What are the application scenarios of eBPF?
Network Optimization
The eBPF combines high performance and high scalability characteristics, making it the preferred solution for network packet processing in network solutions:
-
High Performance The JIT compiler provides near kernel native code execution efficiency.
-
Highly Scalable Protocol parsing and routing policies can be added quickly in the context of the kernel.
Troubleshooting
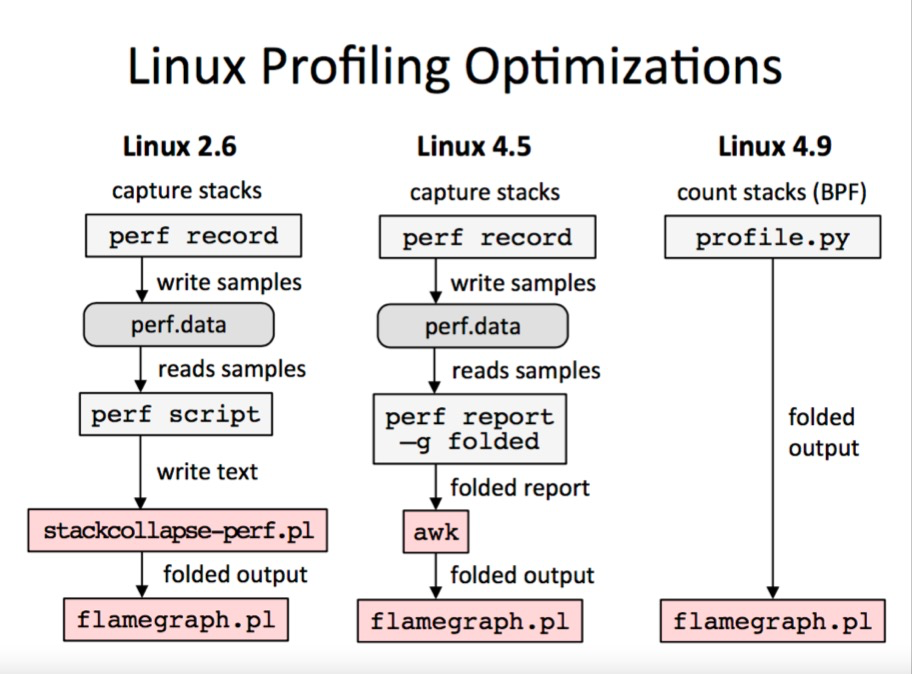
This end-to-end tracing capability allows for fast troubleshooting, while eBPF supports a more efficient way to leverage profiling statistics without the need to leverage large amounts of sampled data like traditional systems, allowing for continuous real-time profiling is possible.

Security Control
eBPF can see all system calls, all network packets and socket network operations. The integration combined with process context tracking, network operation level filtering, and system call filtering can provide better security control.
Performance Monitoring
Compared to traditional system monitoring components such as sar, which can only provide static counters and gauges, eBPF supports programmatically and dynamically collecting and aggregating custom metrics and events at the edge, greatly improving the efficiency and imagination of performance monitoring.
Why did eBPF emerge?
eBPF emerged essentially to solve the contradiction between slow kernel iterations and rapidly changing system requirements. A common example in the eBPF space is that eBPF is similar to the Linux Kernel as Javascript is to HTML, highlighting programmability. In general programmability support usually brings some new problems, for example kernel modules are actually designed to solve this problem, but they do not provide good boundaries, resulting in kernel modules affecting the stability of the kernel itself, the need to do adaptations in different kernel versions, etc. eBPF uses the following strategies to make it a safe and efficient kernel programmable technology.
-
Security eBPF programs must be verified by the verifier before execution and cannot contain unreachable instructions. eBPF programs cannot call kernel functions at will, only auxiliary functions defined in the API. eBPF program stack space is at most 512 bytes, and if you want larger storage, you have to use mapped storage.
-
Efficient With the help of the Just-In-Time (JIT) compiler, and because eBPF instructions still run in the kernel, there is no need to copy data to the user state, which greatly increases the efficiency of event processing.
-
Standard Provides standard interfaces and data models for developers to use through BPF Helpers, BTF, PERF MAP.
-
Powerful Features eBPF not only extends the number of registers and introduces a new BPF mapping store, but also gradually extends the original single packet filtering event in the 4.x kernel to include kernel state functions, user state functions, trace points, performance events (perf_events), and security controls.
How to use eBPF?

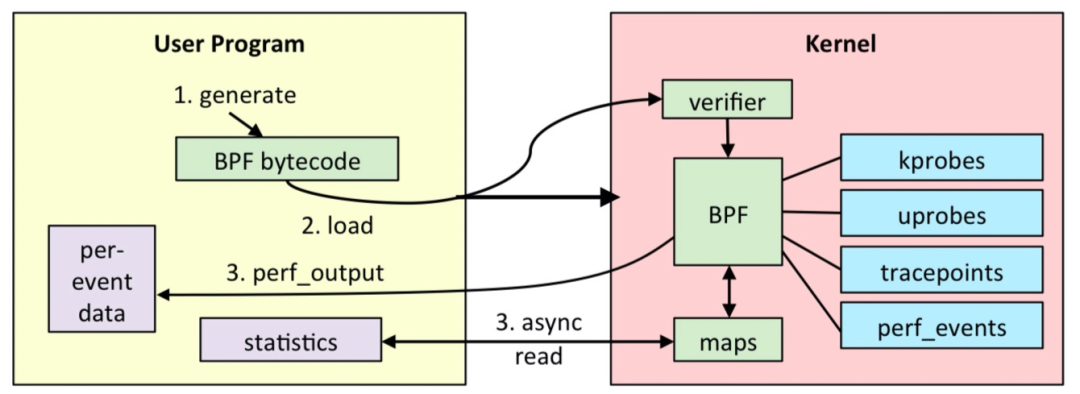
5 steps
-
develop an eBPF program using C language.
i.e., the eBPF sandbox program to be called when the staking point triggers an event, which will run in the kernel state.
-
compile the eBPF program into BPF bytecode with the help of LLVM.
The eBPF program is compiled into BPF bytecode for subsequent verification and running inside the eBPF VM.
-
committing the BPF bytecode to the kernel via the bpf system call.
Load the BPF bytecode into the kernel via the bpf system in the user state.
-
the kernel verifies and runs the BPF bytecode and saves the corresponding state to the BPF mapping.
The kernel verifies that the BPF bytecode is safe and ensures that the correct eBPF program is called when the corresponding event occurs. If there is state to be saved, it is written to the corresponding BPF mapping, for example, monitoring data can be written to the BPF mapping.
-
the user program queries the operational status of BPF bytecode through BPF mapping.
The user state gets the status of bytecode operation by querying the content of BPF mapping, such as getting the captured monitoring data.
A complete eBPF program usually consists of two parts: the user state program needs to interact with the kernel through BPF system calls to perform tasks such as eBPF program loading, event mounting, and mapping creation and update; while in the kernel state, the eBPF program cannot arbitrarily call kernel functions, but needs to perform the required tasks through BPF helper functions. In particular, when accessing memory addresses, memory data must be read with the help of the bpf_probe_read family of functions to ensure safe and efficient access to memory. When eBPF programs require large blocks of storage, we also need to introduce a specific type of BPF mapping depending on the application scenario and provide running state data to the user space programs with the help of it.
eBPF program classification and usage scenarios
|
|
The above command allows you to view the types of eBPF programs supported by the system, which are generally of the following types.
|
|
For details, please refer to: https://elixir.bootlin.com/linux/v5.13/source/include/linux/bpf_types.h
It is mainly divided into 3 major usage scenarios.
-
tracing tracepoint, kprobe, perf_event, etc., are mainly used to extract trace information from the system, which in turn provides data support for monitoring, troubleshooting, performance optimization, etc.
-
Network xdp, sock_ops, cgroup_sock_addr , sk_msg, etc., mainly used to filter and process network packets, and then implement various rich functions such as network observation, filtering, traffic control and performance optimization, etc., where packets can be dropped and redirected.

cilium basically uses all hook points.
-
security and others
lsm, for security, and others are flow_dissector, lwt_in are some of the less commonly used, not to repeat.
What are the best practices for eBPF?
Finding the kernel stubbing point
As you can see from the previous section the eBPF program itself is not difficult, the difficulty is finding the right event source for it to trigger the run. For the monitoring and diagnostic domain, the event sources for trace-like eBPF programs contain 3 categories: kernel functions (kprobe), kernel trace points (tracepoint) or performance events (perf_event). At this point there are 2 questions that need to be answered.
-
What kernel functions, kernel trace points or performance events are available in the kernel?
-
For kernel functions and kernel trace points, how do you query the definition format of these data structures when you need to trace their incoming parameters and return values?
For details on how to use the above information, please refer to bcc.
Find the staking point of the application
-
How to query the tracking points of user processes?
-
Static compiled language keeps debugging information by -g compile option, application binary will contain DWARF (Debugging With Attributed Record Format), with debugging information, you can query the list of functions, variables and other symbols available for tracing by readelf, objdump, nm and other tools.
-
Using bpftrace
-
uprobe is file-based. When a function in a file is traced, by default all processes that use this file are staked, unless the process PID is filtered.
The above is a statically compiled language, which is similar to the kernel trace in that the application symbolic information can be stored in the ELF binary or as a separate file in the debug file, while the kernel symbolic information can be stored in the kernel binary, but also as /proc/kallsyms and /sys/kernel/debug, etc. to user space.
For non-statically compiled languages, there are two main types.
-
Interpretive Languages
Using a trace point query method similar to compiled language applications, querying their uprobe and USDT trace points at the interpreter level, how to correlate the interpreter level behavior with the application behavior needs to be analyzed by experts of the language in question.
-
Just-In-Time Compiled Languages
Similar to interpreted programming languages, uprobe and USDT traces can only be used on just-in-time compilers to obtain the final application function information from the just-in-time compiler’s trace point parameters. Finding the relationship between the trace points of a live compiler and the application runtime requires an expert in the language in question.
See BCC’s application tracing, user process tracing, which is essentially a breakpoint to execute uprobe handlers. Although the kernel community has done a lot of performance tuning for BPF, tracing user-state functions (especially high-frequency functions like lock contention and memory allocation) can have a significant performance overhead. Therefore, we should try to avoid tracking high-frequency functions when using uprobe.
For details on how to use the above information, please refer to: https://github.com/iovisor/bcc/blob/master/docs/reference_guide.md#events–arguments
Related Issues and Staking Points
An ideal state is that all issues are clear should be observed those staking points, but this requires technical staff on the end-to-end software stack details are very thorough understanding of a more reasonable approach is the rule of two or eight, the software stack data flow of the most core 80% of the pulse to capture, to ensure that problems will be found in this vein can be. At this point and then use the kernel stack and user stack to view the specific call stack can be found in the core of the problem, for example, found that the network is losing packets, but do not know why, at this time we know that the network packet loss will definitely call kfree_skb kernel function, then we can pass.
|
|
Discover the call stack of the function.
|
|
Then you can go back to the functions above and see exactly which line they were called under what conditions and you will be able to locate the problem. This method can not only locate the problem, but can also be used to deepen the understanding of kernel calls, for example.
|
|
All network-related trace points and their call stacks can be viewed.
What is the principle of eBPF implementation?

5 modules
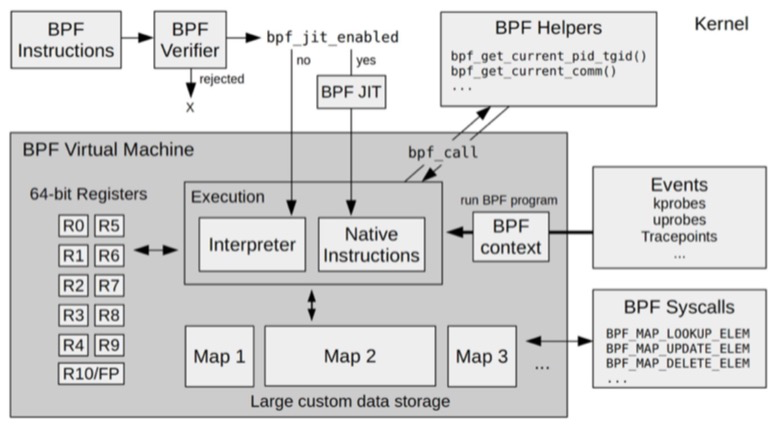
The eBPF is collaborated in the kernel by 5 main modules.
-
BPF Verifier Ensures the security of eBPF programs. The verifier creates the instructions to be executed as a directed acyclic graph (DAG) to ensure that the program does not contain unreachable instructions; then it simulates the execution of the instructions to ensure that no invalid instructions are executed. Here we learn from talking to individual students that the verifier here does not guarantee 100% security, so for all BPF programs, strict monitoring and review is still needed.
-
BPF JIT Compiles eBPF bytecode into native machine instructions for more efficient execution in the kernel.
-
A memory module consisting of multiple 64-bit registers, a program counter and a 512-byte stack Used to control the operation of eBPF programs, save stack data, incoming and outgoing parameters.
-
BPF Helpers (helper functions) A set of functions is provided for eBPF programs to interact with other modules in the kernel. These functions are not available to any eBPF program; the exact set of functions available is determined by the BPF program type. Note that all changes to incoming and outgoing parameters inside eBPF must conform to the BPF specification, except for changes to local variables, which should be done using BPF Helpers, and cannot be modified if not supported by BPF Helpers.
1bpftool feature probeThe above command allows you to see which BPF Helpers can be run for different types of eBPF programs.
-
BPF Map & context is used to provide large blocks of storage that can be accessed by user space programs to control the running state of eBPF programs.
1bpftool feature probe | grep map_type
The above command allows you to see which types of maps are supported by the system.
3 actions
Let’s start with the important system call bpf.
|
|
Here cmd is the key, attr is the parameter of cmd, size is the size of the parameter, so the key is to see which cmd is.
|
|
The most core is PROG, MAP related cmd, which is program loading and mapping processing.
-
Program loading
Calling the BPF_PROG_LOAD cmd loads the BPF program into the kernel, but the eBPF program does not run there all the time after startup like a regular thread, it needs events to trigger before it executes. These events include system calls, kernel trace points, calls to kernel functions and user state functions to exit, network events, and so on, so a 2nd action is required.
-
Binding events
1b.attach_kprobe(event="xxx", fn_name="yyy")The above is to bind a specific event to a specific BPF function, the actual implementation principle is as follows.
- With the help of the bpf system call, the returned file descriptor is remembered after the BPF program is loaded.
- The event number of the corresponding function type is known through the attach operation.
- Call perf_event_open to create a performance monitoring event based on the return value of attach.
- Bind the BPF program to the performance monitoring event by ioctl’s PERF_EVENT_IOC_SET_BPF command.
-
Mapping operations
Through the MAP-related cmd, the MAP additions and deletions are controlled, and then the user state interacts with the kernel state based on that MAP.
The current state of development of eBPF?
Kernel support
Recommendation >= 4.14
Ecology
The bottom-up ecology of eBPF is as follows.
-
Infrastructure
Support the development of eBPF infrastructure capabilities.
- Linux Kernal
- LLVM
-
Development toolset
It is mainly used to load, compile and debug eBPF programs, and there are different development toolsets for different languages.
-
eBPF Application
Provides a set of development tools and scripts.
- bpftrace(https://github.com/iovisor/bpftrace)
Based on bcc, a scripting language is provided.
- cilium(https://github.com/cilium/cilium)
Network Optimization and Security
Network Security
High-performance 4-tier load balancing
- Hubble(https://github.com/cilium/hubble)
Observable
- Kindling(https://github.com/CloudDectective-Harmonycloud/kindling)
- Pixie(https://github.com/pixie-io/pixie)
- kubectl trace(https://github.com/iovisor/kubectl-trace)
Scheduling bpftrace script
Platform for launching and managing eBPF programs in a distributed environment
Dynamic linux tracing
-
Tracking the ecological website
Write at the end
The prerequisite for using eBPF well is the understanding of the software stack
Through the above introduction, I believe you have enough understanding of eBPF. eBPF provides only a framework and mechanism, the core still requires people who use eBPF to understand the software stack and find the right insertion point that can be associated with the application problem.
eBPF’s killer feature is full coverage, non-intrusive, programmable
-
Full coverage Kernel, full coverage of application staking points.
-
Non-intrusive No need to modify any of the hooked code.
-
Programmable Dynamic distribution of eBPF programs, dynamic execution of instructions at the edge, dynamic aggregation analysis.