This article was supposed to talk about how Go Memory Ballast and Go GC Tuner adjust GC, how they are implemented, and how they work. But in the process of writing it, I found out that Go 1.19 is out and there is a new feature that makes these two optimizations history after all.
Overview
First let’s take a brief look at what is done in Go GC and what are the more time consuming parts of it so that we can optimize it.
First of all, there are several phases of GC:
- sweep termination: STW is triggered and all P’s enter the safe-point.
- the mark phase: resumes program execution and the GC executes the root mark, which includes scanning all stacks, global objects, and runtime data structures that are not in the heap.
- the mark termination: triggering STW, reversing the GC state, closing the GC worker thread, etc.
- the sweep phase: resumes program execution with a background concurrent cleanup of all memory management units.
In these phases, since the mark phase is to traverse the heap from the root node and color mark the surviving objects, the mark time is related to the current surviving objects, not the heap size, i.e. the garbage objects on the heap do not increase the mark time of GC.
And since freeing memory is a very fast operation for modern operating systems, Go’s GC time is largely determined by the marking phase, not the cleanup phase.
When is a GC triggered?
There are three main places in Go where GC is triggered.
- a timed call to runtime.sysmon in the monitor thread.
- manually calling the runtime.GC function for garbage collection.
- runtime.mallocgc is called when memory is requested, depending on the size of the heap.
runtime.sysmon
The runtime.sysmon function runs in the background when a Go program is started, and is used to check for deadlocks, run timers, schedule preemptions, and GC.
It executes the test function in runtime.gcTrigger to determine if a GC should be performed, and since GCs can take a long time to execute, a Goroutine is opened at application startup to execute the forcegchelper function.
However, the forcegchelper function is normally kept pending by the goparkunlock function. When the sysmon trigger GC verification passes, the hung Goroutine is put into the global scheduling queue waiting to be scheduled for GC execution.
runtime.GC
This is relatively simple, it will get the current GC cycle count and then set the value to gcTriggerCycle mode to call gcStart for the cycle.
runtime.mallocgc
When memory is allocated, objects are divided by size into three categories: tiny malloc, small alloc, and large alloc.
Go’s memory allocation uses a pooling technique, similar to the CPU design, and is divided into three levels of cache: a separate cache pool mcache for each thread, a central cache mcentral, and a heap page mheap.
tiny malloc and small alloc will first look for free memory blocks in the mcache to allocate memory, and if no memory is allocated in the mcache, it will go to the mcentral or mheap to request memory, which will then try to trigger GC; and for large alloc, it will definitely try to trigger GC because it directly allocates memory on the heap page. for large alloc will definitely try to trigger GC because it directly allocates memory on the heap page.
How to control whether the GC should be executed or not?
The above three GC triggers will eventually call gcStart to execute the GC, but before executing the GC, we must first determine whether this call should be executed, not every call will definitely execute the GC, at this time we need to talk about the test function in runtime.gcTrigger, this function is responsible for checking whether this GC should be executed.
The test function in runtime.gcTrigger ultimately determines whether a GC should be executed based on its three policies.
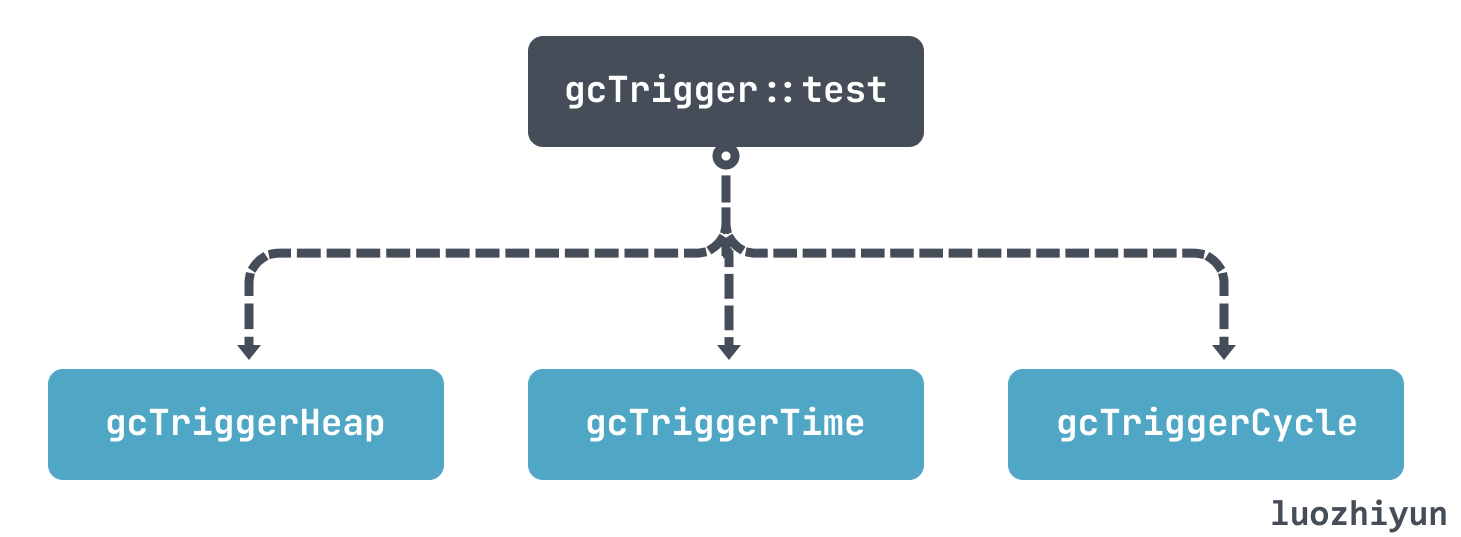
- gcTriggerHeap: triggered by heap size, triggered when the heap size reaches a certain threshold compared to the last GC.
- gcTriggerTime: triggered by time, if it has not been GC’d for more than forcegcperiod (default 2 minutes), then GC will be executed.
- gcTriggerCycle: triggered if garbage collection is not turned on, then a new cycle is triggered.
If it is a gcTriggerHeap policy, then it will determine whether or not to perform GC based on the value calculated in the runtime.gcSetTriggerRatio function, which is mainly determined by the environment variable GOGC (default value is 100) to determine what the threshold value is.
We can roughly assume that the timing of triggering GC is determined by the growth rate of the heap memory size at the last GC, compared to the current heap memory size value, which is the environment variable GOGC, default is 100, and the calculation formula can be roughly understood as follows.
|
|
Assuming that the current memory footprint is 100M, then according to the above formula, the GC will be triggered only when it reaches 200M.
The timing of the GC trigger is not only determined by a single GOGC variable, but also by the code runtime.gcSetTriggerRatio, which controls a range of
|
|
The calculation of the specific threshold is more complex, as seen in the gcControllerState.endCycle function, the timing of the GC execution depends on the following factors.
- current CPU usage, the maximum GC tagging phase cannot exceed 25% of the entire application.
- Auxiliary GC tagging object CPU usage.
- Target growth rate (estimated), which is equal to: (heap size after the next GC - heap live size) / heap live size.
- actual heap growth rate: total heap size / live size after the last marker - 1.
- the size of the heap growth rate triggered at the last GC.
The value obtained from these combined factors is the current triggered GC heap growth rate size. These can be printed out by GODEBUG=gctrace=1,gcpacertrace=1.
Let’s look at a concrete example.
Use gctrace to track GC.
|
|
The above shows 3 GC’s, below we look at.
|
|
You can see that the heap size after marking is 7 MB, but the target estimate given is 5 MB, you can see that the recycler exceeds the target set by 2 MB, so this target value is also inaccurate.
In 1410 GCs, the heap size after the last marker is 3 MB, so we can roughly guess that the heap size should not exceed 6 MB in the next GC based on GOGC, so we can look at 1411 GCs.
|
|
You can see that the heap size is 5 MB at the start of 1411 GCs, which is within the control range.
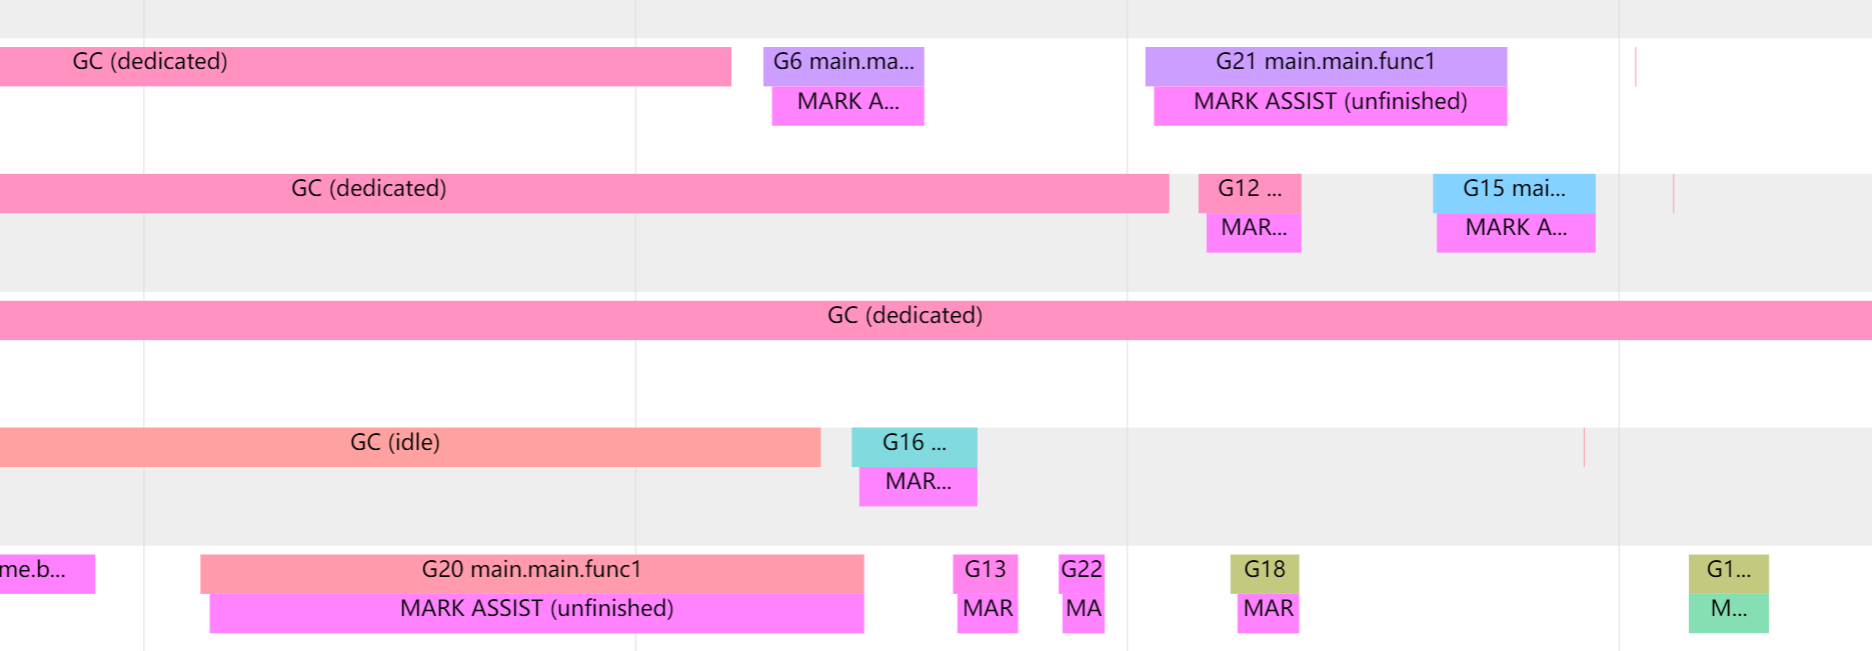
Having said all these GC mechanisms, is it possible that the speed of GC cannot catch up with the speed of garbage creation? This brings us to another mechanism in GC: Mark assist.
If the collector determines that it needs to slow down allocation, it will recruit application goroutines to assist in the marking effort. This is called Mark assist. This is why it is necessary to determine whether to perform a mallocgc GC when allocating memory.
Goroutines will pause their current work while Mark assist is performed, which will cause some delay in the task that Goroutines are currently working on.
Our GC will also try to eliminate Mark assist as much as possible, so the next GC will be earlier, which will cause the GC to be triggered more often.
We can observe Mark assist by using the go tool trace.
Go Memory Ballast
After we got familiar with the Go GC strategy above, let’s see how Go Memory Ballast optimizes GC. Here’s an example.
|
|
We run the above code snippet and then we do a simple count of the resource utilization.
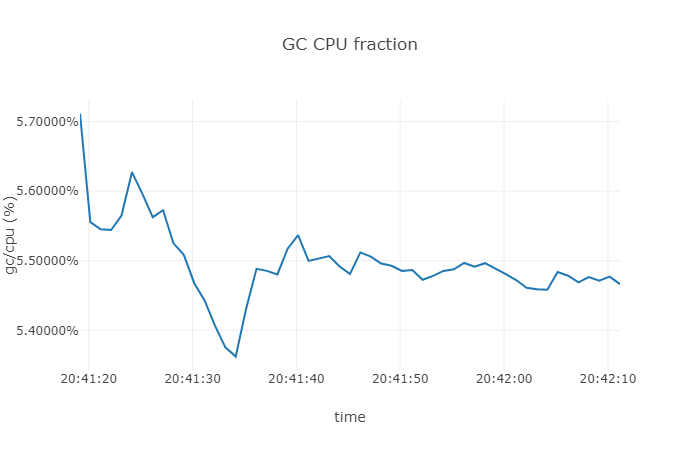
From the above results we can see that the CPU utilization of GC is around 5.5 %.
Let’s remove the ballast memory usage and see what it would be.
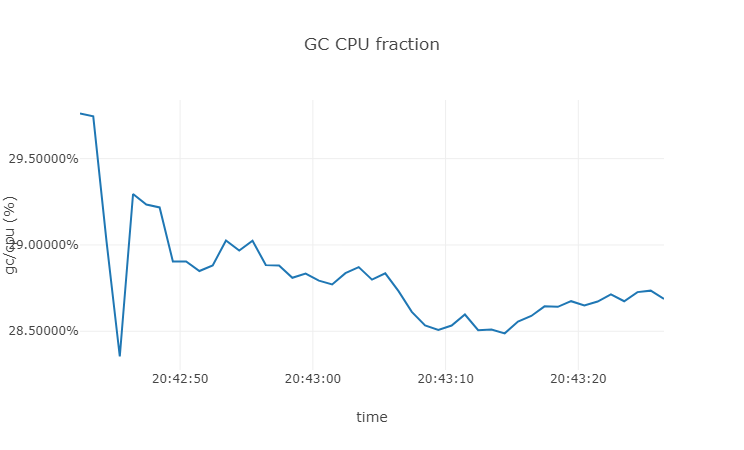
You can see that the CPU usage of GC is around 28% when there is no ballast. For those who are interested in other information about GC, you can use runtime.Memstats to grab the GC information periodically and print it.
So why is the CPU usage so much lower after requesting an empty array? First of all, as we mentioned in the overview, the GC will decide the next GC execution time based on the environment variable GOGC. So if we request an array of 200M, the next GC will be at about 400M. Since the objects requested by the allocate function in our example above are temporary objects, they will be reduced to about 200M again after the GC, so the next GC will be set to 400M again.
However, if you don’t have ballast array, you can test it by yourself, it will trigger GC at about 4M, which will undoubtedly cause quite frequent GC for systems with more temporary variables.
In short, by setting the ballast array, we have achieved the effect of delaying GC, but this effect is only useful for systems with more temporary variables, not for systems with more global variables.
Then there is another question, is it a waste of memory to request 200M of memory in the system for no reason? After all, memory is so expensive. Actually, don’t worry, as long as we don’t read or write to the ballast array, we won’t really use the physical memory footprint, as we can see with the following example.
|
|
You can see that the virtual memory VSZ is very large, but the size of the memory allocated by the RSS process is very small.
|
|
But if we want to write to it, the memory size allocated by the RSS process will become larger, and the rest can be verified by yourself.
For the Go Ballast discussion was actually mentioned a long time ago issue, in fact, the official only need to add a minimum heap size parameter can be, but has not been implemented. In contrast, Java is much better GC tuning parameters, InitialHeapSize can set the initial value of the heap.
This has led to many performance-critical projects such as tidb and cortex to add such an empty array implementation to their code.
Go GC Tuner
This method is actually introduced in this article from uber. The fundamental problem is that Go’s GC is too frequent, causing the marker to take up a high CPU, but Go also provides GOGC to adjust the timing of GC, so is there a way to dynamically adjust the value of GOGC according to the current memory, so as to control the frequency of GC?
Go actually provides the runtime.SetFinalizer function, which will be called back at the end when the object is GC’d. In Go, it is defined as follows.
An obj is generally a pointer to an object; a finalizer is a function that takes a single argument that can be directly assigned with an obj type value. That is, SetFinalizer is a function that sets the destructor of an obj object to finalizer, and when the garbage collector finds that the obj can no longer be accessed directly or indirectly, it will clean up the obj and call finalizer.
So we can use it to set a hook to check the memory situation after each GC and then set the GOGC value to.
|
|
The above code takes advantage of the finalizer feature and calls getCurrentPercentAndChangeGOGC at GC time to reset the GOGC value, and since the finalizer extends the life of the object once, we can call SetFinalizer again after setting the GOGC in the finalizerHandler to rebind the object to the finalizer. SetFinalizer is called again to rebind the object to the Finalizer.
This constitutes a loop, and each GC will have a finalizerRef object dynamically changing the GOGC value according to the current memory situation, thus achieving the purpose of adjusting the number of GCs and saving resources.
As we mentioned above, the GC basically calculates the timing of the next GC based on the heap size after the current GC.
|
|
For example, if the heap size live_dataset is 100 M after this GC, the default value of 100 for GOGC will trigger a GC when the heap size is 200M.
In order to maximize the memory utilization and reduce the number of GCs, then we can set GOGC to
|
|
This means that if there is a machine with all the memory for our application, and the application currently occupies 10%, or 100M, then.
|
|
Of course, we can’t be that extreme in production, and the specific maximum percentage of available memory needs to be adjusted according to the current situation.
Then, converted into code, our getCurrentPercentAndChangeGOGC can be written as follows
|
|
The above code I omitted a lot of exception handling, default handling, and memoryLimitInPercent written as a fixed value, in the real use, the code needs to be improved.
At this point, the above Go Memory Ballast and Go GC Tuner have achieved our optimization goals.
Soft Memory Limit
This optimization is from issue#48409 and was added in Go 1.19. The principle of the optimization is actually similar to the above, with the built-in debug.SetMemoryLimit function we can adjust the target value of heap memory for triggering The built-in debug.SetMemoryLimit function allows us to adjust the target value of heap memory for triggering GC, thus reducing the number of GCs and the CPU usage during GC.
As we mentioned above, Go implements three strategies for triggering GCs, one of which is gcTriggerHeap, which sets the heap target value for the next GC based on the heap size. The code in version 1.19 modifies the gcTriggerHeap policy.
We can see from the code call that two methods are used to calculate the HeapGoal in gcControllerState.heapGoalInternal, one is calculated by the GOGC value and the other is calculated by the memoryLimit value, and then the smaller of the two is taken as the HeapGoal.
|
|
The gcPercentHeapGoal is calculated as follows.
|
|
is not very different from the hard_target calculation we mentioned above and can be understood as follows
|
|
Let’s look at the memoryLimitHeapGoal calculation again.
|
|
The above code can basically be understood as follows
|
|
So because the Go GC is triggered by the smaller of the above two calculations, we can now add the memoryLimit parameter to limit the OOM if we used to fill the GOGC too much; or we can just set the memoryLimit parameter with GOGC = off and use it to allocate our GC.
Summary
The Go Memory Ballast is a pre-defined large array that allows Go to raise the heap memory threshold for the next Go GC trigger at startup, thus avoiding unnecessary consumption when there is enough memory but a lot of temporary variables in the application.
Go GC Tuner mainly uses the GC hooks provided by Go to set the Finalizer to dynamically set the GOGC by the current memory usage after the GC, so as to reduce the GC.
Soft Memory Limit is a new feature in version 1.19 that enables GC control in a built-in way. By setting memoryLimit to control the GC memory trigger threshold to achieve the purpose of reducing GC. The principle is actually not fundamentally different from the above two methods, but because it is built into the GC loop, it can check the current non-heap memory usage in a more fine-grained way, thus achieving more precise control.