Built from multiple microservice components that can run as a horizontally scalable distributed system, Loki is uniquely designed to compile the code of an entire distributed system into individual binaries or Docker images, with the behavior of the individual binaries controlled by the -target command line flag.
Standalone mode
The simplest mode of operation is to set -target=all, which is the default way and does not need to be specified. This is the monolithic mode, which runs all of Loki’s microservice components in a single process in the form of a single binary or Docker image.
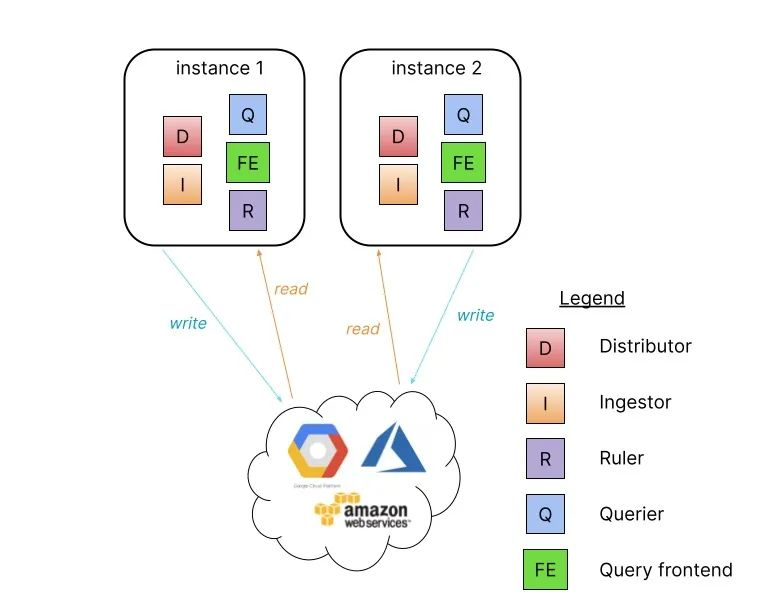
The monolithic mode is useful for getting started with Loki quickly and for reads and writes with data volumes of about 100GB per day. Scaling the monolithic mode deployment level to more instances can be done by using a shared object store and configuring the memberlist_config property to share state between all instances.
High availability can be configured by running two Loki instances with memberlist_config configuration and a shared object store. Traffic is routed to all Loki instances in a round-robin fashion. Parallel queries are limited by the number of instances and the defined query parallelism.
Installation of the monolithic model is very simple and is done directly using the Helm Chart package grafana/loki-stack.
Read/Write Separation Mode
If you have more than a few hundred GB of logs per day, or if you want to separate reads and writes, Loki offers a simple scalable deployment model. This deployment mode can scale to several terabytes or more of logs per day.
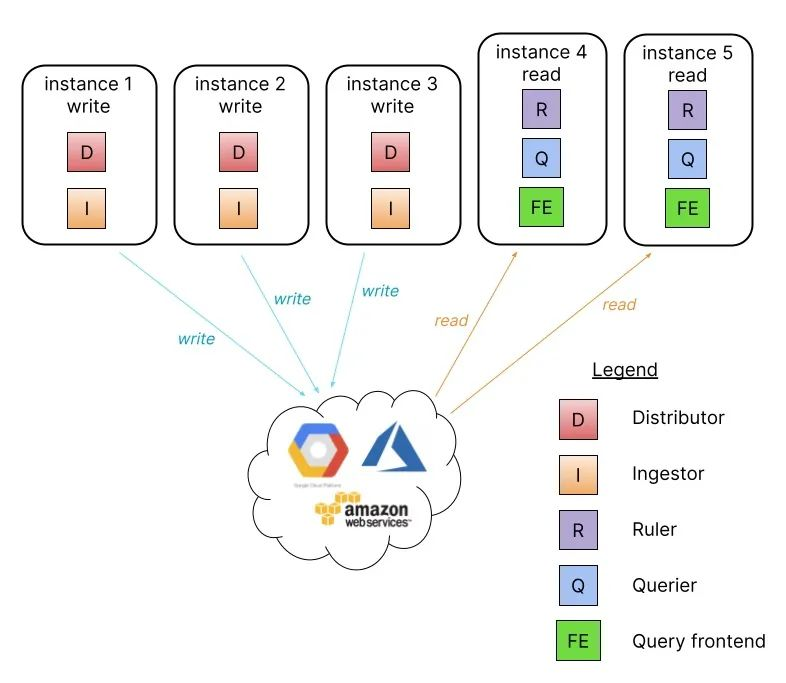
In this mode, Loki’s component microservices are bound to two targets: -target=read and -target=write, and the BoltDB compactor service will run as part of the read target.
Separating the read and write paths has the following advantages.
- Improved availability of the write path by providing dedicated nodes
- Read paths can be scaled separately to add/remove query performance on demand
This read/write separation pattern requires a load balancer in front of Loki that routes /loki/api/v1/push traffic to the write node, all other requests go to the read node, and traffic should be sent in a round-robin fashion.
Installation
We also use Helm Chart for installation, first getting the Chart package for the read-write separation model.
1
2
3
|
$ helm repo add grafana https://grafana.github.io/helm-charts
$ helm pull grafana/loki-simple-scalable --untar --version 1.4.1
$ cd loki-simple-scalable
|
The Chart package supports the components shown in the table below. Ingester, distributor, querier, and query-frontend are installed, and the other components are optional.
| Loki component |
is optional |
is enabled by default |
| gateway |
✅ |
✅ |
| write |
❎ |
n/a |
| read |
❎ |
n/a |
Here we use MinIO as a remote data store and configure the number of copies of Loki instances to be read and written to be 2. In order to add a load balancer in front of Loki, we need to enable Gateway, and the corresponding Values file is shown below.
 1
 2
 3
 4
 5
 6
 7
 8
 9
10
11
12
13
14
15
16
17
18
19
20
21
22
23
24
25
26
27
28
29
30
31
32
33
34
35
36
37
38
39
40
41
42
43
44
45
46
47
48
49
50
51
52
53
54
55
56
57
58
59
60
61
62
63
64
65
66
67
68
69
70
71
72
|
# ci/minio-values.yaml
loki:
  commonConfig:
    path_prefix: /var/loki
    replication_factor: 2
  authEnabled: false

# Configuration for the write
write:
  # -- Number of replicas for the write
  replicas: 3
  affinity: |
    podAntiAffinity:
      preferredDuringSchedulingIgnoredDuringExecution:
        - weight: 1
          podAffinityTerm:
            labelSelector:
              matchLabels:
                {{- include "loki.writeSelectorLabels" . | nindent 12 }}
            topologyKey: kubernetes.io/hostname
  persistence:
    size: 1Gi
    storageClass: local-path

# Configuration for the read node(s)
read:
  # -- Number of replicas for the read
  replicas: 3
  affinity: |
    podAntiAffinity:
      preferredDuringSchedulingIgnoredDuringExecution:
        - weight: 1
          podAffinityTerm:
            labelSelector:
              matchLabels:
                {{- include "loki.readSelectorLabels" . | nindent 12 }}
            topologyKey: kubernetes.io/hostname
  persistence:
    size: 1Gi
    storageClass: local-path

# Configuration for the gateway
gateway:
  # -- Specifies whether the gateway should be enabled
  enabled: true
# -------------------------------------
# Configuration for `minio` child chart
# -------------------------------------
minio:
  enabled: true
  accessKey: enterprise-logs
  secretKey: supersecret
  service:
    type: NodePort
    nodePort: 32000
  buckets:
    - name: chunks
      policy: none
      purge: false
    - name: ruler
      policy: none
      purge: false
    - name: admin
      policy: none
      purge: false
  persistence:
    size: 1Gi
    storageClass: local-path
  resources:
    requests:
      cpu: 100m
      memory: 256Mi
|
Then use the values file above to install Loki in read-write mode.
 1
 2
 3
 4
 5
 6
 7
 8
 9
10
11
12
13
14
15
16
17
18
19
20
21
22
23
24
25
26
27
28
29
30
31
32
33
34
35
36
37
38
39
40
41
42
43
44
45
46
47
48
49
|
$ helm upgrade --install loki -n logging -f ci/minio-values.yaml .
Release "loki" does not exist. Installing it now.
NAME: loki
LAST DEPLOYED: Fri Jun 17 14:53:20 2022
NAMESPACE: logging
STATUS: deployed
REVISION: 1
TEST SUITE: None
NOTES:
***********************************************************************
 Welcome to Grafana Loki
 Chart version: 1.4.1
 Loki version: 2.5.0
***********************************************************************

Installed components:
* gateway
* read
* write

This chart requires persistence and object storage to work correctly.
Queries will not work unless you provide a `loki.config.common.storage` section with
a valid object storage (and the default `filesystem` storage set to `null`), as well
as a valid `loki.config.schema_config.configs` with an `object_store` that
matches the common storage section.

For example, to use MinIO as your object storage backend:

loki:
  config:
    common:
      storage:
        filesystem: null
        s3:
          endpoint: minio.minio.svc.cluster.local:9000
          insecure: true
          bucketnames: loki-data
          access_key_id: loki
          secret_access_key: supersecret
          s3forcepathstyle: true
    schema_config:
      configs:
        - from: "2020-09-07"
          store: boltdb-shipper
          object_store: s3
          schema: v11
          index:
            period: 24h
            prefix: loki_index_
|
After the installation is complete, check the Pod status to see if it is OK.
 1
 2
 3
 4
 5
 6
 7
 8
 9
10
|
$ kubectl get pods -n logging
NAME                            READY   STATUS    RESTARTS   AGE
loki-gateway-67f76958d7-bq46l   1/1     Running   0          91m
loki-minio-87c9bc6f5-jxdcn      1/1     Running   0          70m
loki-read-0                     1/1     Running   0          81s
loki-read-1                     1/1     Running   0          81s
loki-read-2                     1/1     Running   0          81s
loki-write-0                    1/1     Running   0          81s
loki-write-1                    1/1     Running   0          81s
loki-write-2                    1/1     Running   0          81s
|
You can see that two copies of Loki are deployed for write and read respectively, and there is also a Pod for gateway, which is actually an nginx application that routes /loki/api/v1/push requests to the write node, which we can verify by looking at the configuration of gateway.
 1
 2
 3
 4
 5
 6
 7
 8
 9
10
11
12
13
14
15
16
17
18
19
20
21
22
23
24
25
26
27
28
29
30
31
32
33
34
35
36
37
38
39
40
41
42
43
44
45
46
47
48
49
50
51
52
53
54
55
56
57
58
59
60
61
62
63
64
65
66
67
68
69
70
71
72
73
74
75
76
77
78
79
80
81
82
83
84
|
$ kubectl get cm -n logging loki-gateway -o yaml
apiVersion: v1
data:
  nginx.conf: |
    worker_processes  5;  ## Default: 1
    error_log  /dev/stderr;
    pid        /tmp/nginx.pid;
    worker_rlimit_nofile 8192;

    events {
      worker_connections  4096;  ## Default: 1024
    }

    http {
      client_body_temp_path /tmp/client_temp;
      proxy_temp_path       /tmp/proxy_temp_path;
      fastcgi_temp_path     /tmp/fastcgi_temp;
      uwsgi_temp_path       /tmp/uwsgi_temp;
      scgi_temp_path        /tmp/scgi_temp;

      default_type application/octet-stream;
      log_format   main '$remote_addr - $remote_user [$time_local]  $status '
            '"$request" $body_bytes_sent "$http_referer" '
            '"$http_user_agent" "$http_x_forwarded_for"';
      access_log   /dev/stderr  main;

      sendfile     on;
      tcp_nopush   on;
      resolver kube-dns.kube-system.svc.cluster.local;

      server {
        listen             8080;

        location = / {
          return 200 'OK';
          auth_basic off;
        }

        location = /api/prom/push {
          proxy_pass       http://loki-write.logging.svc.cluster.local:3100$request_uri;
        }

        location = /api/prom/tail {
          proxy_pass       http://loki-read.logging.svc.cluster.local:3100$request_uri;
          proxy_set_header Upgrade $http_upgrade;
          proxy_set_header Connection "upgrade";
        }

        location ~ /api/prom/.* {
          proxy_pass       http://loki-read.logging.svc.cluster.local:3100$request_uri;
        }

        location = /loki/api/v1/push {
          proxy_pass       http://loki-write.logging.svc.cluster.local:3100$request_uri;
        }

        location = /loki/api/v1/tail {
          proxy_pass       http://loki-read.logging.svc.cluster.local:3100$request_uri;
          proxy_set_header Upgrade $http_upgrade;
          proxy_set_header Connection "upgrade";
        }

        location ~ /loki/api/.* {
          proxy_pass       http://loki-read.logging.svc.cluster.local:3100$request_uri;
        }
      }
    }
kind: ConfigMap
metadata:
  annotations:
    meta.helm.sh/release-name: loki
    meta.helm.sh/release-namespace: logging
  creationTimestamp: "2022-06-17T06:53:22Z"
  labels:
    app.kubernetes.io/component: gateway
    app.kubernetes.io/instance: loki
    app.kubernetes.io/managed-by: Helm
    app.kubernetes.io/name: loki
    app.kubernetes.io/version: 2.5.0
    helm.sh/chart: loki-simple-scalable-1.4.1
  name: loki-gateway
  namespace: logging
  resourceVersion: "4968787"
  uid: ba9ba1c0-8561-41cb-8b55-287f352b5ee8
|
The above is a typical Nginx configuration, from which you can see that the requests /api/prom/push and /loki/api/v1/push for the Push API are proxied to the http://loki-write.logging.svc.cluster.local:3100$ request_uri;, the two loki-write nodes above, while the read-related interfaces are proxied to the loki-read node, and then the loki-write start-up parameters are configured with -target=write and loki-read start-up parameters with -target=read. to achieve read/write separation. However, the read and write applications share the same configuration file, as shown below.
 1
 2
 3
 4
 5
 6
 7
 8
 9
10
11
12
13
14
15
16
17
18
19
20
21
22
23
24
25
26
27
28
29
30
31
32
33
34
35
36
37
38
39
40
41
42
|
$ kubectl get cm -n logging loki -o yaml
apiVersion: v1
data:
  config.yaml: |
    auth_enabled: false
    common:
      path_prefix: /var/loki
      replication_factor: 2
      storage:
        s3:
          access_key_id: enterprise-logs
          bucketnames: chunks
          endpoint: loki-minio.logging.svc:9000
          insecure: true
          s3forcepathstyle: true
          secret_access_key: supersecret
    limits_config:
      enforce_metric_name: false
      max_cache_freshness_per_query: 10m
      reject_old_samples: true
      reject_old_samples_max_age: 168h
      split_queries_by_interval: 15m
    memberlist:
      join_members:
      - loki-memberlist
    ruler:
      storage:
        s3:
          bucketnames: ruler
    schema_config:
      configs:
      - from: "2022-06-17"
        index:
          period: 24h
          prefix: loki_index_
        object_store: s3
        schema: v12
        store: boltdb-shipper
    server:
      grpc_listen_port: 9095
      http_listen_port: 3100
......
|
where common.storage.s3 specifies the MinIO-related configuration, and memberlist.join_members specifies the members, which are actually all the read/write nodes.
 1
 2
 3
 4
 5
 6
 7
 8
 9
10
11
|
$ kubectl get svc loki-memberlist -n logging -o wide
NAME              TYPE        CLUSTER-IP   EXTERNAL-IP   PORT(S)    AGE   SELECTOR
loki-memberlist   ClusterIP   None         <none>        7946/TCP   54m   app.kubernetes.io/instance=loki,app.kubernetes.io/name=loki,app.kubernetes.io/part-of=memberlist
$ kubectl get pods -n logging -l app.kubernetes.io/part-of=memberlist
NAME           READY   STATUS    RESTARTS   AGE
loki-read-0    1/1     Running   0          32s
loki-read-1    1/1     Running   0          72s
loki-read-2    1/1     Running   0          115s
loki-write-0   1/1     Running   0          4s
loki-write-1   1/1     Running   0          55s
loki-write-2   1/1     Running   0          116s
|
Here we are done with the deployment of Loki read-write mode.
Promtail writing data
To verify that the application is working properly, next we install Promtail and Grafana for reading and writing data.
Get the promtail Chart package and unpack it.
1
2
|
$ helm pull grafana/promtail --untar
$ cd promtail
|
Create a values file as follows.
1
2
3
4
5
|
# ci/simple-values.yaml
rbac:
  pspEnabled: false
config:
  lokiAddress: http://loki-gateway/loki/api/v1/push
|
Note that we need to configure the Loki address in Promtail to be http://loki-gateway/loki/api/v1/push so that Promtail sends the log data to the Gateway first, and then the Gateway forwards it to the write node based on our Endpoints. node, using the values file above to install Promtail.
 1
 2
 3
 4
 5
 6
 7
 8
 9
10
11
12
13
14
15
16
17
18
19
|
$ helm upgrade --install promtail -n logging -f ci/simple-values.yaml .
Release "promtail" does not exist. Installing it now.
NAME: promtail
LAST DEPLOYED: Fri Jun 17 16:01:08 2022
NAMESPACE: logging
STATUS: deployed
REVISION: 1
TEST SUITE: None
NOTES:
***********************************************************************
 Welcome to Grafana Promtail
 Chart version: 5.1.0
 Promtail version: 2.5.0
***********************************************************************

Verify the application is working by running these commands:

* kubectl --namespace logging port-forward daemonset/promtail 3101
* curl http://127.0.0.1:3101/metrics
|
A promtail will be run on each node after a normal installation.
1
2
3
4
5
|
$ kubectl get pods -n logging -l app.kubernetes.io/name=promtail
NAME             READY   STATUS    RESTARTS   AGE
promtail-5r9hl   1/1     Running   0          2m25s
promtail-85mk4   1/1     Running   0          2m25s
promtail-qlfnv   1/1     Running   0          2m25s
|
Normal promtail is already collecting all the container logs on the node, and then pushing the log data to the gateway, which forwards it to the write node, where we can view the gateway logs.
1
2
3
4
5
|
$ kubectl logs -f loki-gateway-67f76958d7-bq46l -n logging
10.244.1.170 - - [17/Jun/2022:08:09:03 +0000]  204 "POST /loki/api/v1/push HTTP/1.1" 0 "-" "promtail/2.5.0" "-"
10.244.1.170 - - [17/Jun/2022:08:09:04 +0000]  204 "POST /loki/api/v1/push HTTP/1.1" 0 "-" "promtail/2.5.0" "-"
10.244.2.205 - - [17/Jun/2022:08:09:05 +0000]  204 "POST /loki/api/v1/push HTTP/1.1" 0 "-" "promtail/2.5.0" "-"
......
|
You can see that the gateway is now receiving requests directly from /loki/api/v1/push, which is what promtail is sending. Normally, the log data is now distributed to the write node, which stores the data in minio. You can check to see if there is already log data in minio. The minio service was assigned a NodePort of 32000 when it was installed.
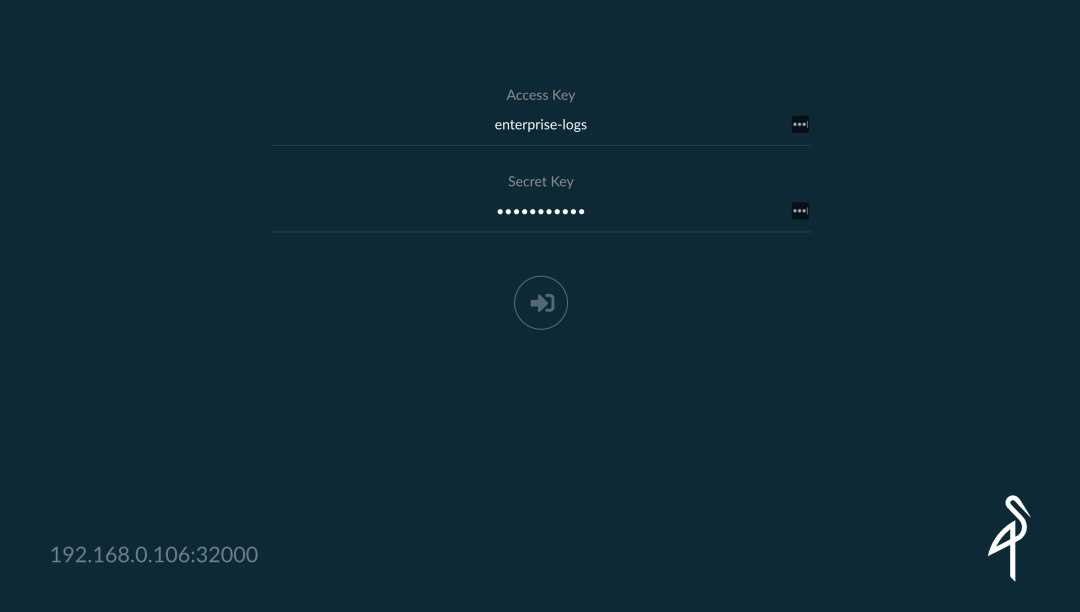
The login credentials are
- accessKey: enterprise-logs
- secretKey: supersecret
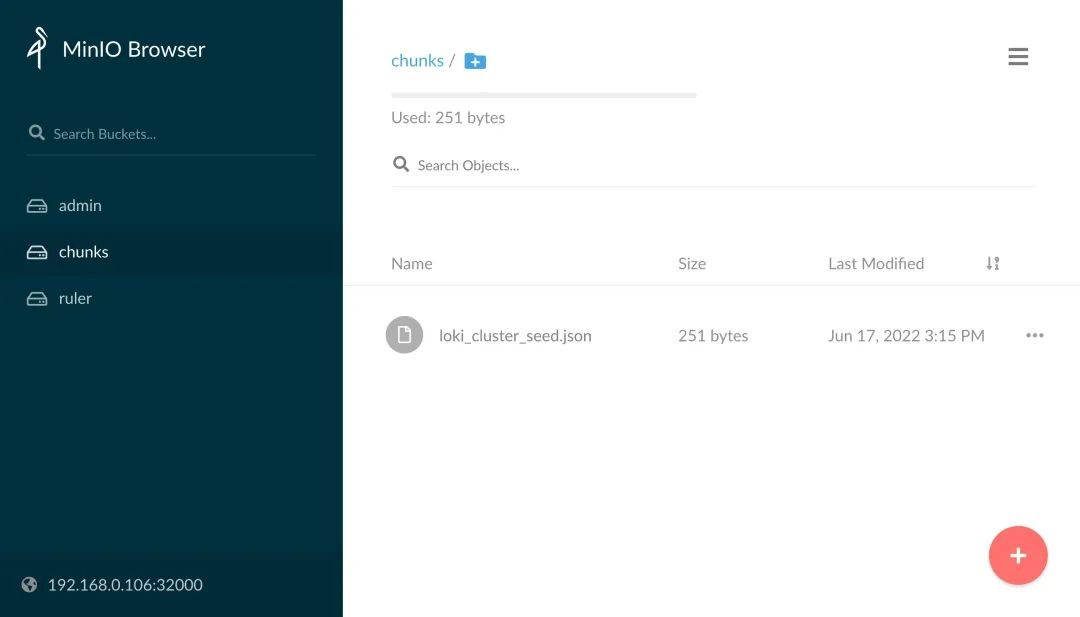
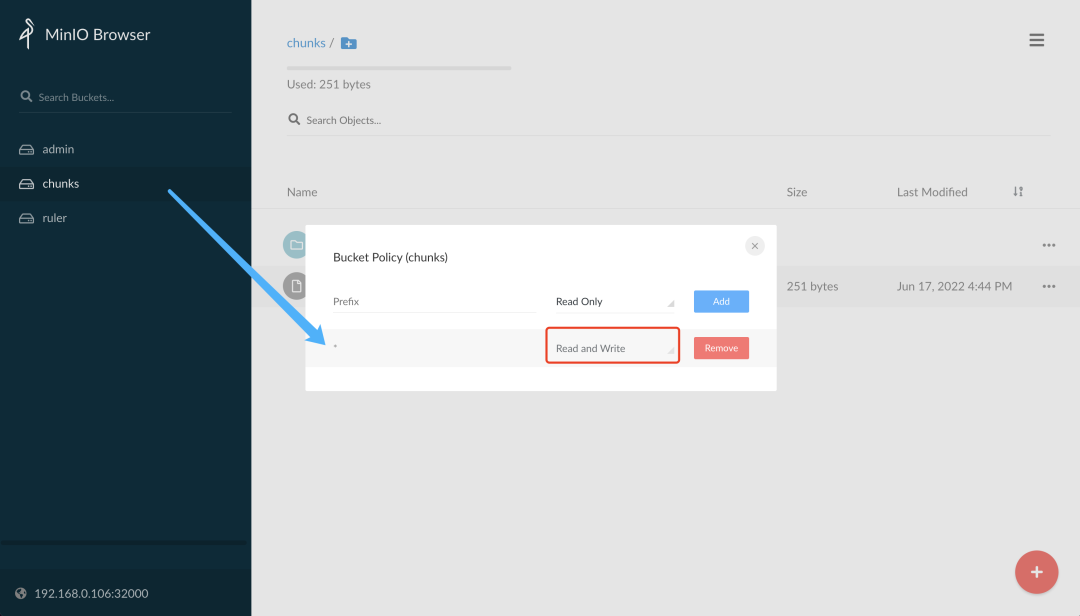
You can see that there is no log data in the chunks bucket of minio. This is because the bucket we created above only has read permission by default, and we can change the bucket to have read and write permission.
After normal modifications, a fake directory is created, which is the default data directory without multi-tenancy provisioning, under which the chunk data of the logs are stored.
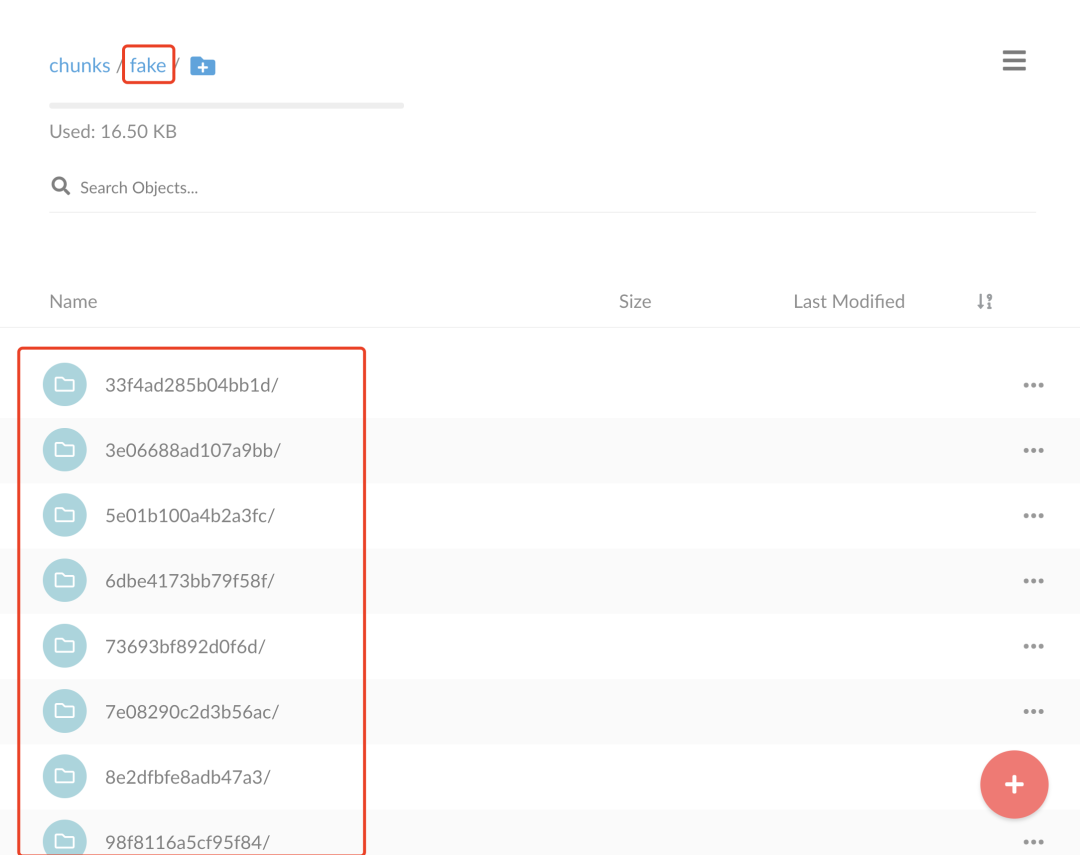
This is the path to where the Loki logs are written.
Grafana Read Data
Let’s verify the read path and install Grafana to interface with Loki.
1
2
|
$ helm pull grafana/grafana --untar
$ cd grafana
|
Create the values configuration file as follows.
 1
 2
 3
 4
 5
 6
 7
 8
 9
10
11
12
|
# ci/simple-values.yaml
service:
  type: NodePort
  nodePort: 32001
rbac:
  pspEnabled: false
persistence:
  enabled: true
  storageClassName: local-path
  accessModes:
    - ReadWriteOnce
  size: 1Gi
|
Install Grafana directly using the values file above.
 1
 2
 3
 4
 5
 6
 7
 8
 9
10
11
12
13
14
15
16
17
18
19
20
21
22
23
|
$ helm upgrade --install grafana -n logging -f ci/simple-values.yaml .
Release "grafana" has been upgraded. Happy Helming!
NAME: grafana
LAST DEPLOYED: Fri Jun 17 17:00:24 2022
NAMESPACE: logging
STATUS: deployed
REVISION: 2
NOTES:
1. Get your 'admin' user password by running:

   kubectl get secret --namespace logging grafana -o jsonpath="{.data.admin-password}" | base64 --decode ; echo

2. The Grafana server can be accessed via port 80 on the following DNS name from within your cluster:

   grafana.logging.svc.cluster.local

   Get the Grafana URL to visit by running these commands in the same shell:
export NODE_PORT=$(kubectl get --namespace logging -o jsonpath="{.spec.ports[0].nodePort}" services grafana)
     export NODE_IP=$(kubectl get nodes --namespace logging -o jsonpath="{.items[0].status.addresses[0].address}")
     echo http://$NODE_IP:$NODE_PORT


3. Login with the password from step 1 and the username: admin
|
The login password can be obtained by using the command in the prompt above.
1
|
$ kubectl get secret --namespace logging grafana -o jsonpath="{.data.admin-password}" | base64 --decode ; echo
|
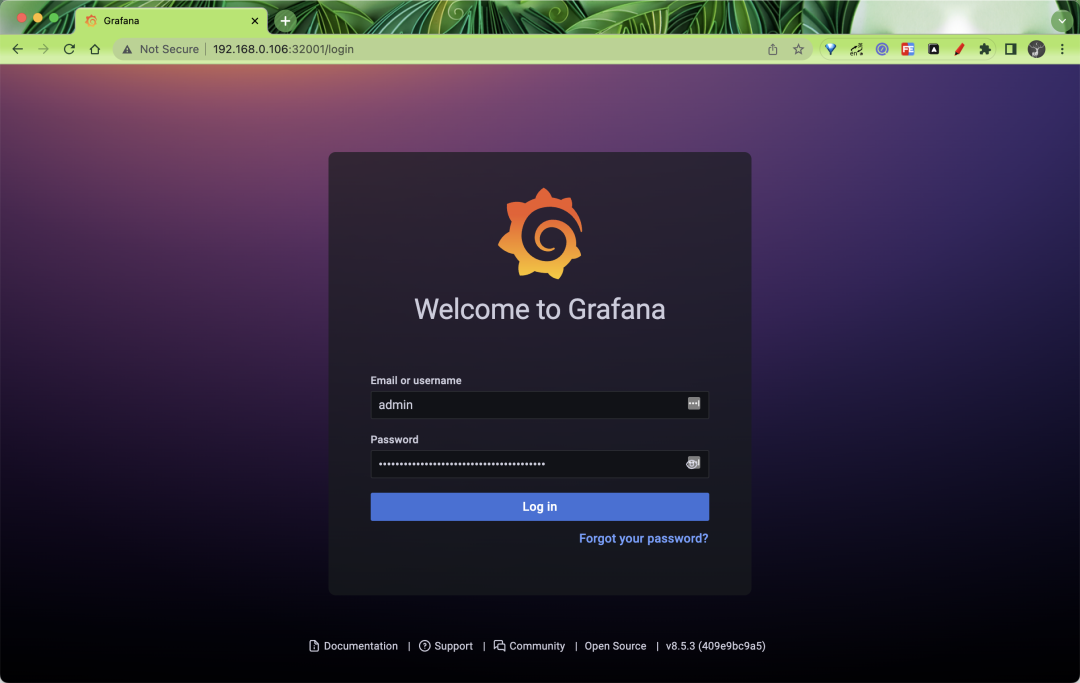
Then log in to Grafana using the password and admin username above.
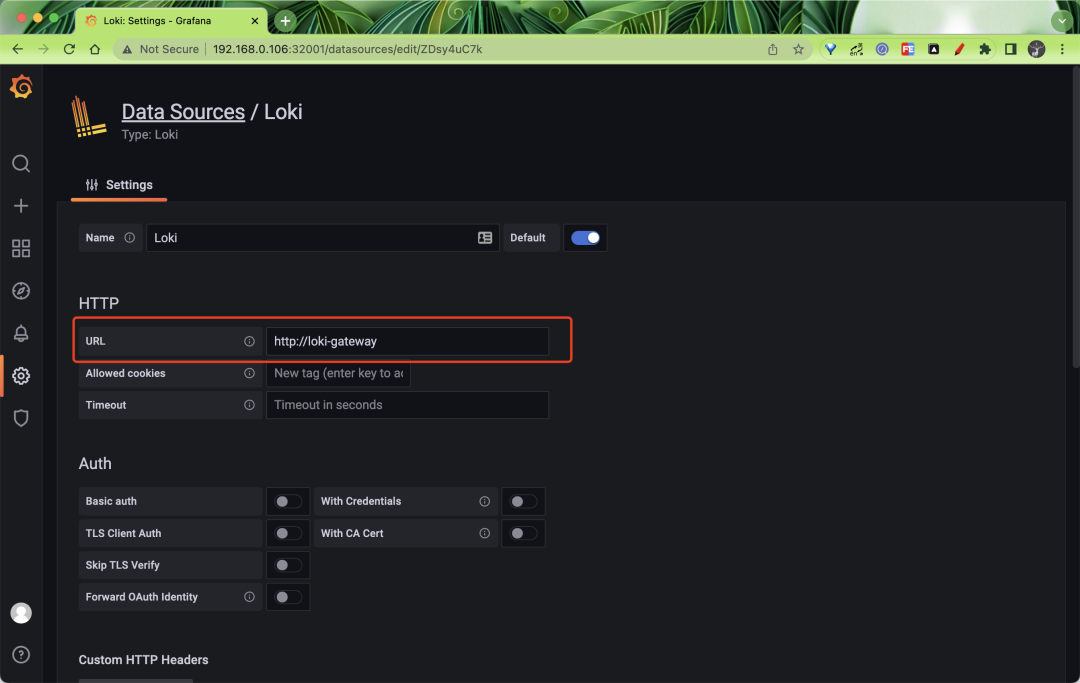
After logging in, go to Grafana and add a data source. Here you need to fill in the gateway address http://loki-gateway.
After saving the data source, you can go to the Explore page to filter the logs, for example, we are here to view the logs of the gateway application in real time, as shown in the following figure.
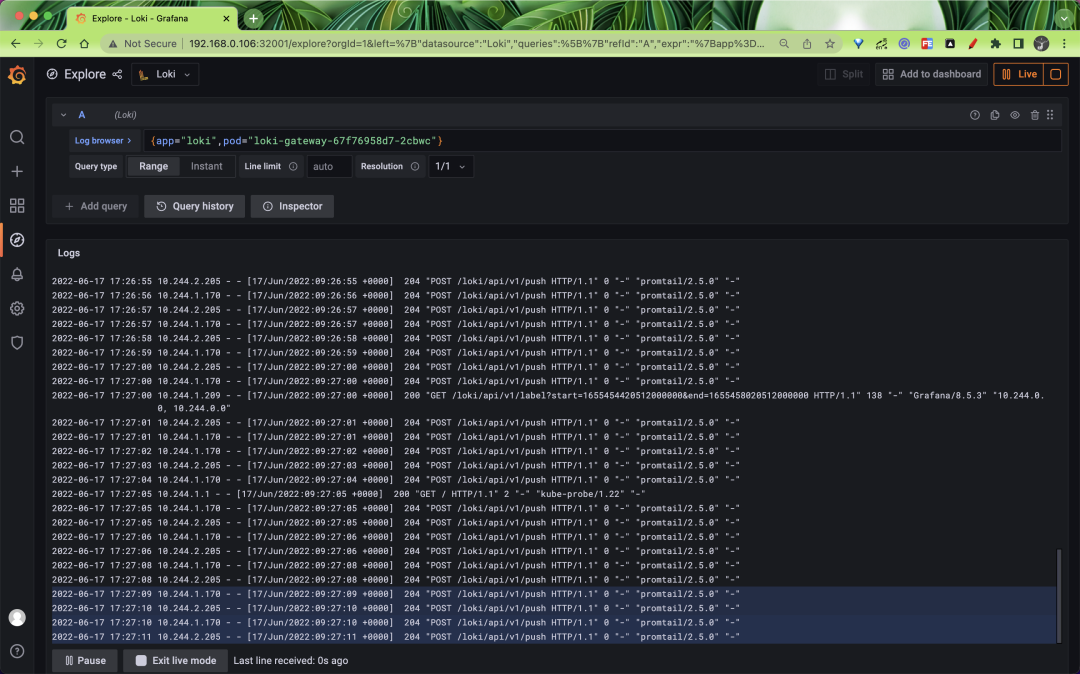
If you can see the latest log data that means we have successfully deployed Loki in read-write separation mode, read-write separation mode can greatly improve the performance and capacity of Loki, if this mode is not enough to meet your data volume, then you can use microservice mode to deploy Loki.