1. Preface
In our recent work, we found that some nodes in the K8s cluster had high resource usage and some nodes had low resource usage. We tried to redeploy the application and evict the Pod, but found that it did not effectively solve the load imbalance problem. After learning the Kubernetes scheduling principle, we retooled the Request configuration and introduced the scheduling plugin to finally solve the problem. This article will share with you the knowledge about Kubernetes resources and scheduling, and how to solve the K8s scheduling imbalance problem.
2. Resource Model for Kubernetes
In Kubernetes, a Pod is the smallest atomic scheduling unit. This means that all scheduling and resource management related properties should be fields that belong to the Pod object. The most important part of this is the Pod’s CPU and memory allocation. Resources such as CPU are called “compressible resources”. Typically, when compressible resources run low, the Pod will just “starve” but will not quit. Resources like memory, on the other hand, are called “incompressible resources.When incompressible resources run low, the Pod is killed by the kernel due to OOM (Out-Of-Memory).Pods can be composed of multiple Containers, so CPU and memory resource limits are configured in the definition of each Container.In this way, the overall resource allocation of a Pod is obtained by adding up the configuration values of these Containers. The CPU and memory resources of Pods in Kubernetes are actually divided into two cases: limits and requests.
The difference is very simple: when scheduling, kube-scheduler only schedules according to the value of requests. When it comes to setting Cgroups limits, the kubelet will set them according to limits. This is because in real-world scenarios, most jobs use far fewer resources than the requested limit, and this strategy can effectively improve overall resource utilization.
3. Quality of Service in Kubernetes
In Kubernetes, each Pod has a QoS tag, which is used to manage the quality of service of Pods by determining the scheduling and eviction priority of Pods. In Kubernetes, there are three levels of QoS quality of service for Pods.
- Guaranteed: When every Container in a Pod has both requests and limits set, and the requests and limits values are equal, the Pod is in the Guaranteed category.
- Burstable: When a Pod does not meet the Guaranteed condition, but at least one Container has set requests, then the Pod is classified as Burstable.
- BestEffort: And if a Pod has neither requests nor limits set, then its QoS category is BestEffort.
Specifically, Eviction can be triggered when there is a shortage of incompressible resources on the hosts managed by Kubernetes. Currently, the default thresholds for Eviction that Kubernetes sets for you are as follows.
When the Eviction threshold of the host is reached, it will enter the MemoryPressure or DiskPressure state to prevent new Pods from being scheduled to this host, and then the kubelet will select Pods for eviction based on the QoS level, the specific eviction priority is: BestEffort -> Burstable -> Guaranteed. The QoS level is achieved by the Linux kernel OOM score, which ranges from -1000 to 1000. In Kubernetes, the OOM scores of common services are as follows.
The higher the OOM score, the lower the priority of the Pod and the sooner it will be killed when there is competition for resources, processes with scores of -999 and -1000 will never be killed due to OOM.
If you expect the Pod to be as non-evicted as possible, you should set all requests and limits for each Container in the Pod, and the requests and limits values should be equal.
4. Scheduling Policy for Kubernetes
kube-scheduler is the default scheduler for Kubernetes clusters, and its primary responsibility is to find the most appropriate Node for a newly created Pod. kube-scheduler makes a scheduling selection for a Pod in three steps.
- Filtering: Calling a set of scheduling algorithms called Predicate to select all the Nodes that meet the Pod’s scheduling requirements.
- Scoring: a set of scheduling algorithms called Priority is invoked to score each schedulable Node.
- Binding: The scheduler modifies the value of the nodeName field of the Pod object to the Node with the highest score.
Official Kubernetes filtering and scoring orchestration source code: https://github.com/kubernetes/kubernetes/blob/281023790fd27eec7bfaa7e26ff1efd45a95fb09/pkg/scheduler/framework/plugins/legacy_registry.go
4.1 Filtering (Predicate)
The filtering phase, which first iterates through all nodes and filters out those that do not meet the conditions, is a mandatory rule. All Nodes that meet the requirements outputted in this phase will be recorded and used as input for the second phase, and if all nodes do not meet the conditions, then the Pod will remain in the Pending state until a node meets the conditions, during which the scheduler will keep retrying. The scheduler performs the following filtering checks in order based on constraints and complexity, the order of which is stored in a function called PredicateOrdering(), as shown in the table below.
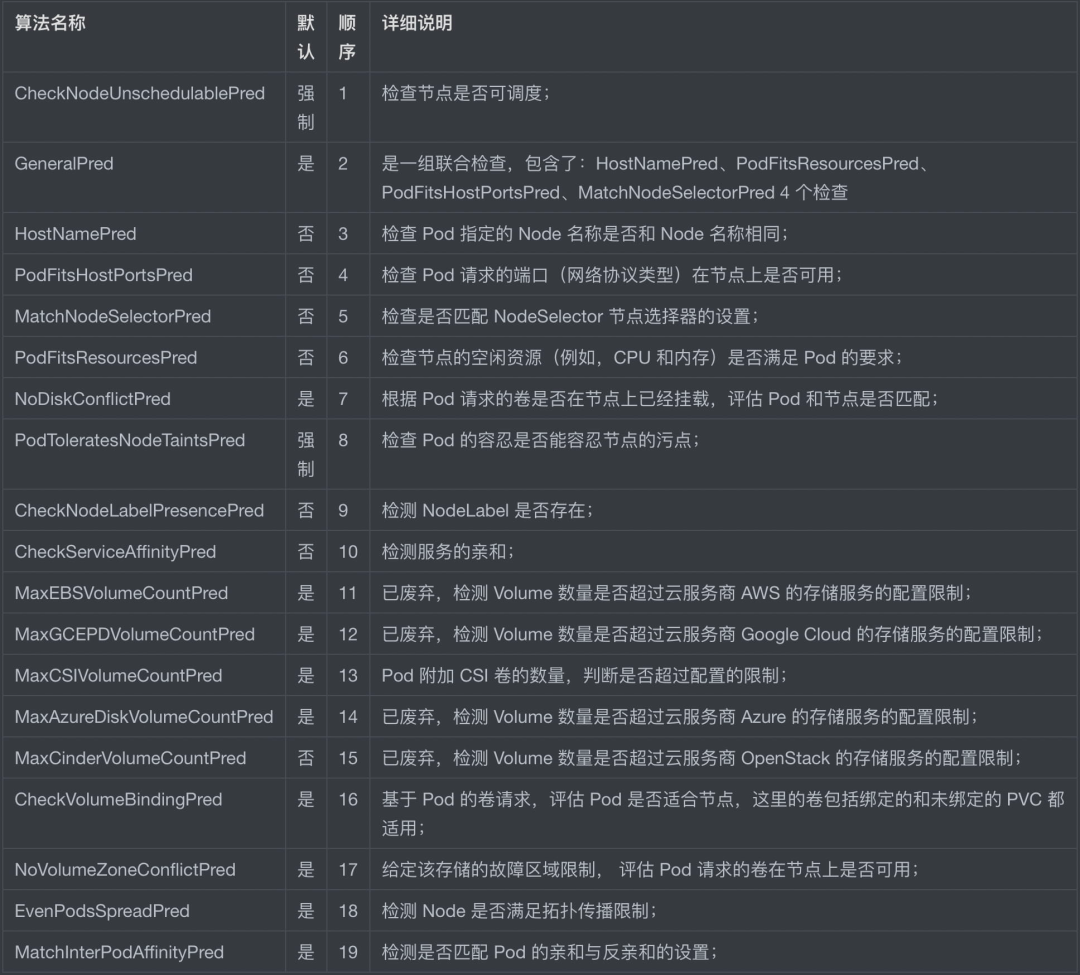
As you can see, Kubernetes is gradually removing the code associated with a specific cloud provider’s services and using Interfaces to extend functionality.
4.2 Scoring (Priority)
In the scoring phase, the available nodes are scored by the Priority policy, and the best node is finally selected. Each scoring function returns a score from 0 to 100, with a higher score indicating a better node, and each function also corresponds to a weight value. The calculated score of each scoring function is multiplied by the weight, and then the scores of all scoring functions are summed to obtain the final priority score of the node. The weights allow the administrator to define the ability of the preference function tendency with the following formula for calculating the priority score.
|
|
The full scoring functions are shown in the table below.
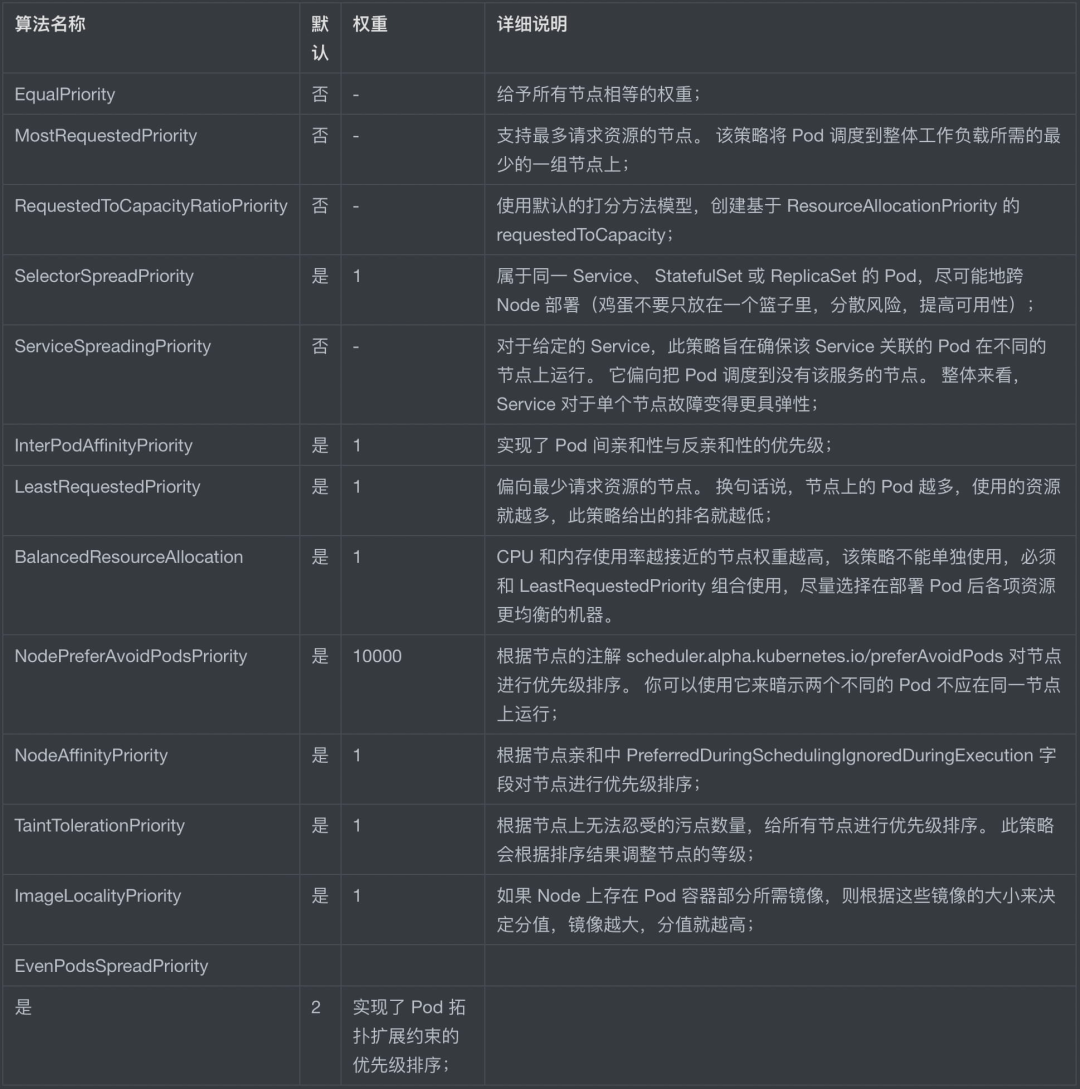
My own problem is the “multi-node scheduling resource imbalance problem”, so the scoring algorithm related to node resources is the focus of my attention.
-
BalancedResourceAllocation (enabled by default), its calculation formula is shown below.
1score = 10 - variance(cpuFraction,memoryFraction,volumeFraction)*10The Fraction of each resource is defined as the requested resource of the Pod / the available resources on the node. The role of the variance algorithm is to calculate the “distance” between the Fraction of each resource. The final choice is the node with the smallest difference in resource Fraction. Therefore, BalancedResourceAllocation selects the node with the most balanced resource allocation among all nodes after the scheduling is completed, so as to avoid the situation that a node has a large CPU allocation and a large memory surplus.
-
LeastRequestedPriority (turned on by default), which is calculated as shown below.
1score = (cpu((capacity-sum(requested))10/capacity) + memory((capacity-sum(requested))10/capacity))/2As you can see, this algorithm actually calculates the host with the most free resources (CPU and Memory) based on the request.
-
MostRequestedPriority (not on by default), which is calculated as shown below.
1score = (cpu(10 sum(requested) / capacity) + memory(10 sum(requested) / capacity)) / 2Replace LeastRequestedPriority in ClusterAutoscalerProvider to give higher priority to nodes that use multiple resources.
You can modify the /etc/kubernetes/manifests/kube-scheduler.yaml configuration to add a new v=10 parameter to enable scheduling scoring logs.
4.3 Custom configuration
If the official default filtering and scoring policy does not meet the actual business, we can customize the configuration.
- Scheduling Policy: allows you to modify the default filtering assertions (Predicates) and scoring priorities (Priorities).
- Scheduling configuration: allows you to implement plugins for different scheduling phases, including QueueSort, Filter, Score, Bind, Reserve, Permit, etc. You can also configure kube-scheduler to run different profiles.
5. Solve K8s scheduling imbalance problem
5.1. Configure Pod requeste by actual usage
From the above scheduling policy, we know that the resource-related scoring algorithms LeastRequestedPriority and MostRequestedPriority are based on request to score, not on the current resource level of the Node (before the installation of resource monitoring components such as Prometheus, the kube-scheduler is also unable to count the current resources of a Node in real time). So you can dynamically pick the resource usage of Pods over time and set Pod requests accordingly to fit kube-scheduler’s default scoring algorithm and make Pod scheduling more balanced.
5.2. Set anti-affinity for Pods with high resource usage
Set anti-affinity for some Pods with high resource usage to prevent these items from being scheduled to the same Node at the same time, resulting in a surge in Node load.
5.3. Introduce real-time resource scoring plugin Trimaran
However, in actual projects, not all cases can estimate Pod resource usage more accurately, so it is inaccurate to rely on request configuration to ensure balanced Pod scheduling. The scheduling plugin Trimaran provided by the SIG group of the official Kubernetes community has this capability.
Trimaran is a real-time load-aware scheduling plugin that uses load-watcher to obtain program resource utilization data. Currently, load-watcher supports three metrics tools: Metrics Server, Prometheus, and SignalFx.
- Kubernetes Metrics Server: It is one of the core components of the kubernetes monitoring system, which is responsible for collecting resource metrics from kubelets, then aggregating these metrics monitoring data (relying on kube-aggregator), and passing them to the Kubernetes Apiserver via the Metrics API ( /apis/metrics.k8s.io/) to expose them publicly.
- Prometheus Server: is an open source monitoring and alerting system based on a temporal database, ideal for monitoring Kubernetes clusters. The basic principle is to periodically capture the state of the monitored component through the Http protocol, any component can access monitoring as long as it provides the corresponding Http interface. There is no need for any SDK or other integration process. This is ideal for virtualized environment monitoring systems, such as VM, Docker, Kubernetes, etc.
- SignalFx: is an infrastructure and application real-time cloud monitoring provider that uses a low-latency, scalable streaming analytics engine to monitor microservices (loosely coupled, independently deployed collections of application components) and orchestrated container environments such as Kubernetes and Docker. Official website address: https://www.splunk.com/en_us/investor-relations/acquisitions/signalfx.html
Trimaran’s architecture is as follows.
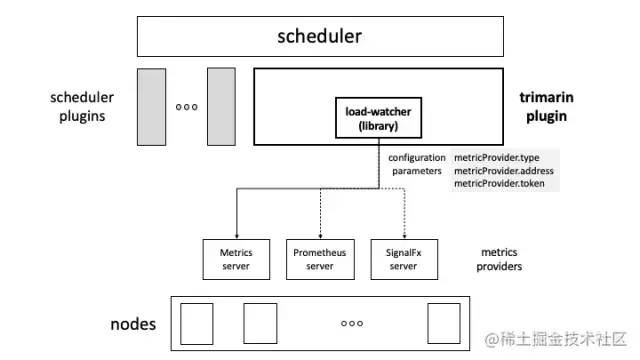
You can see that during the kube-scheduler scoring process, Trimaran gets the real-time resource level of the current node via load-watcher and intervenes in the scheduling result by scoring it accordingly.
Trimaran scoring principle: https://github.com/kubernetes-sigs/scheduler-plugins/tree/master/kep/61-Trimaran-real-load-aware-scheduling
5.4. Introducing the rebalancing tool descheduler
From the perspective of kube-scheduler, the scheduler will make the best scheduling decision based on its resource description of the Kubernetes cluster at that time, but the scheduling is static, and Pods will not trigger rescheduling once they are bound to a node. While the scoring plugin can effectively solve the resource imbalance problem during scheduling, the resources occupied by each Pod will change over time (usually memory will increase). If an application only takes up 2G of memory at startup, but after a while it takes up 4G of memory, if there are more applications like this, the Kubernetes cluster may become unbalanced after a while, so the cluster needs to be rebalanced. In addition, there are other scenarios that require rebalancing.
- New nodes are added to the cluster and some nodes are under- or over-utilized.
- Some nodes fail and their pods have been moved to other nodes.
- The original scheduling decision no longer applies because taint or tags have been added or removed from the nodes and the pod/node affinity requirement is no longer met.
Of course we can go and do some cluster balancing manually, such as manually removing certain Pods and triggering rescheduling on it, but obviously this is a tedious process and not the way to solve the problem. In order to solve the problem of cluster resources not being fully utilized or wasted in practice, we can use the descheduler component to optimize the scheduling of the cluster Pods. The core principle is to find Pods that can be removed and evict them based on their policy configuration, but it does not schedule the evicted Pods itself, but relies on the default scheduler to do so. descheduler rebalancing principle can be found on the website.