Before the eBPF-based next-generation observation facility was mature, we used the industry-established Prometheus+Grafana scheme to collect node and application metrics. Such a scheme is known to be invasive to the application, i.e., it requires a client package embedded inside the application to collect metrics and communicate with Prometheus.
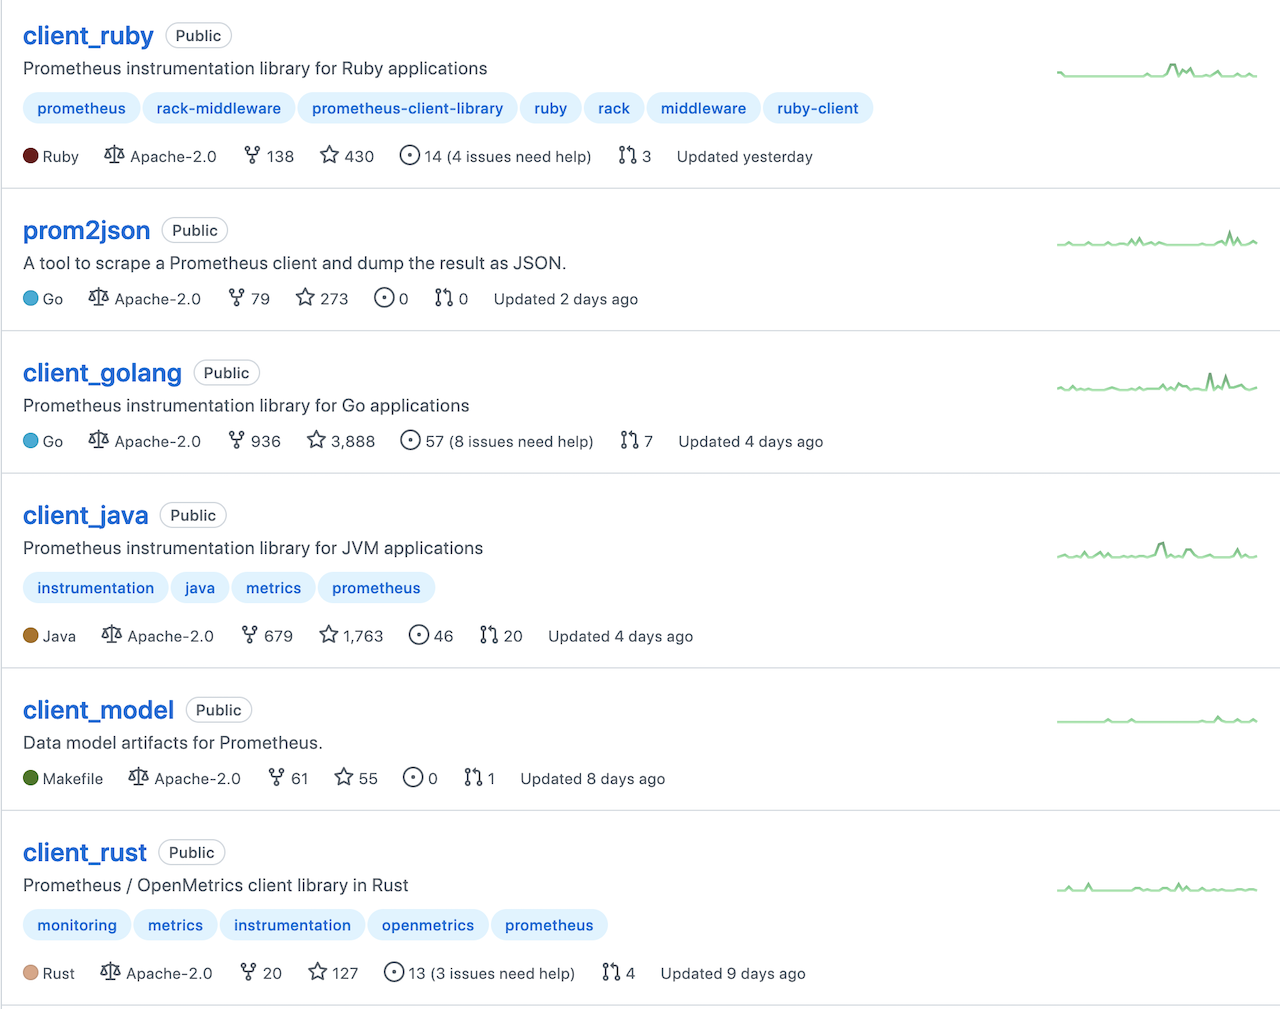
Prometheus officially provides and maintains client packages for major languages, including Go, Java, Python, Ruby, Rust, etc., as follows.
The go client side of Prometheus is not too complicated to use and consists of two steps.
- Register (Register) the metric you want to acquire into Prometheus’ Registry.
- Set up an HTTP Server and expose the metric collection port.
Prometheus uses a pull model (pull) to collect temporal metric data. The data pull behavior is determined by the Prometheus server, for example, the time period for Prometheus to pull each collection point can be set. In general, this technology stack is mature enough to see results immediately after configuration and startup. The technology stack is also very stable and has been working well for us until this week when we ran into a problem during a stress test: Prometheus is not collecting data!
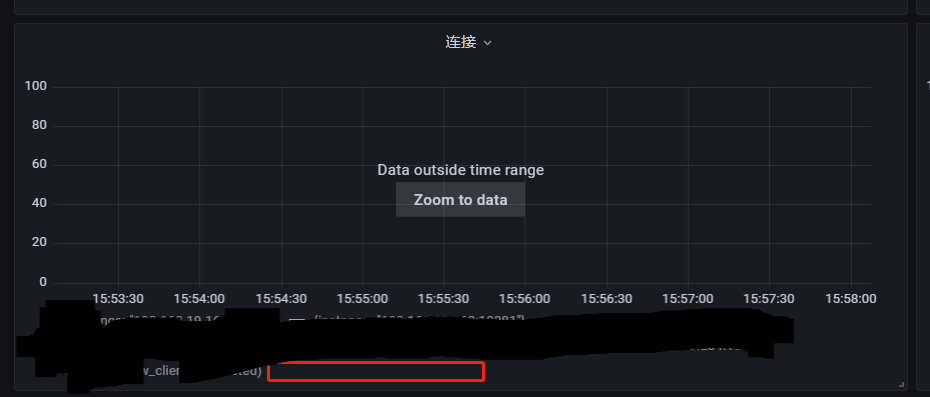
From the initial continuous line of data to “intermittent” dots, see the following figure.
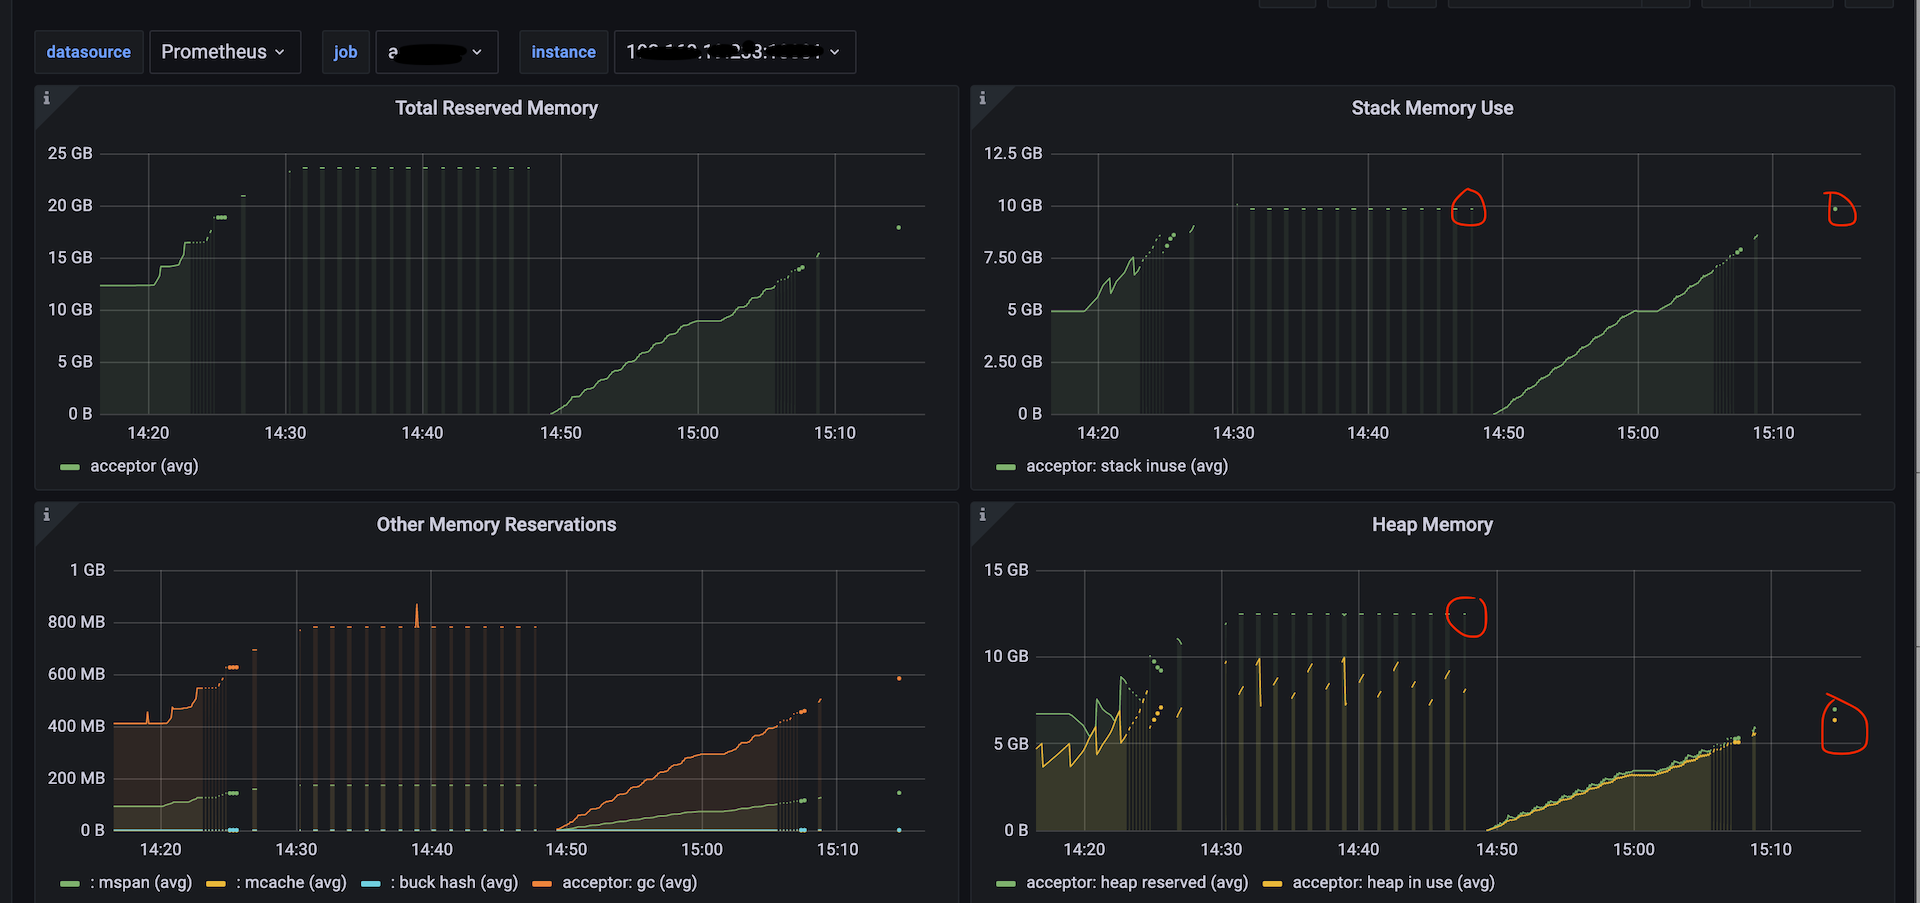
Later on, no data could be collected.
Prometheus was running fine before, so why is it not picking up data now? The difference between this time and the previous one is that in our stress test case scenario, each service node had to establish more than a million connections, whereas before it was only about 10w.
The good thing is that we have deployed the online Continuous Profiling tool, so we can check the resource usage during the stress test period, as follows.
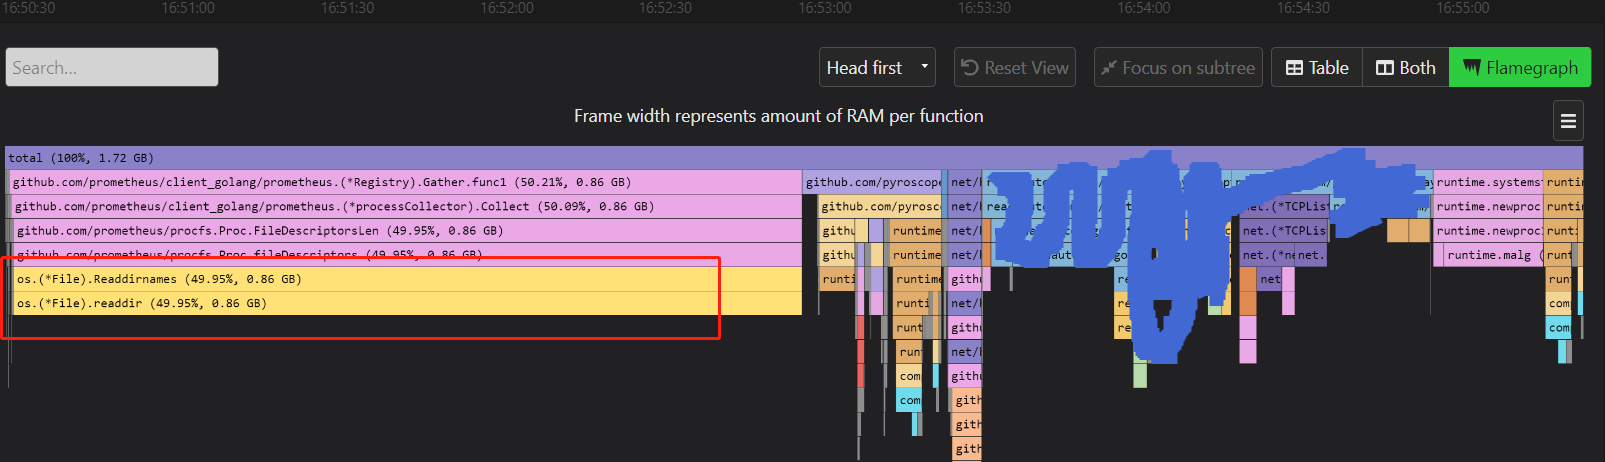
Above is a flame chart of the alloc object, and we see that the Registry.Gather method of the Prometheus client accounts for 50% of the memory allocation overhead, which is very unusual. Continuing to look along the flame chart of the Gather function, we see that the bottom end is actually readdir. None of the metrics registered by our application are collected in a way that requires readdir either!
The only way to solve this problem is to research Prometheus client source code!
We are using the default defaultRegistry of the Prometheus client. From the source code, we can see that the defaultRegistry is initialized with two collectors by default:
We found that: the first processCollector collects data on the following metrics.
When capturing openFDs, processCollector traverses the fd directory under /proc/{pid}.
|
|
When capturing openFDS, processCollector calls the FileDescriptorsLen method, and in the fileDescriptors method called by the FileDescriptorsLen method, we find a call to Readdirnames, see the following source code snippet.
|
|
Normally, reading the /proc/{pid}/fd directory is no problem, but when we have 100w+ connections attached to our program, it means that there are 100w+ files in the fd directory and traversing them one by one will bring a lot of overhead. This is what causes Prometheus to fail to collect the data in time within the timeout period (usually 10s of seconds).
So how to solve this problem?
The temporary solution is to comment out the line MustRegister(NewProcessCollector(ProcessCollectorOpts{})) in the init function of the registry.go file! This process metric information is not very useful to us. However, the downside of this is that we need to maintain a prometheus golang client package ourselves, which requires a go mod replace, which is very inconvenient and does not facilitate version upgrades of the prometheus golang client package.
The solution once and for all is to not use the default Registry, but use the NewRegistry function to create a new Registry . This way we discard the default registry metrics and define our own metrics to be registered. We can also add ProcessCollector when needed, depending on the needs of different Go programs.
After modifying this scheme, those familiar continuous curves are back in sight!