When debugging network quality, we generally focus on two factors: latency and throughput (bandwidth). Latency is easier to verify with a single ping or mtr. This article shares a way to debug throughput.
Scenarios where throughput is important are generally the so-called Long Fat Networks (LFN, rfc7323). For example, downloading large files. The throughput does not reach the upper limit of the network and can be affected by 3 main factors.
- there is a bottleneck on the sending side
- a bottleneck on the receiving side
- a bottleneck in the middle network layer
A bottleneck on the sending side is usually caused by the buffer not being large enough, because the sending process is that the application calls syscall, puts the data to be sent into the buffer, and then the system takes care of sending it out. If the buffer is full, the application blocks (if it uses the block API) until the buffer is available and then continues to write, in producer and consumer mode.
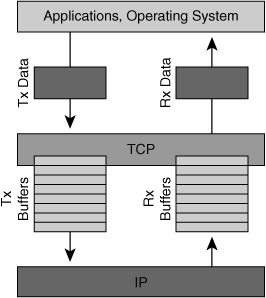
Image from cisco
Bottlenecks on the sending side are generally easier to troubleshoot, even by looking at the application logs to see when they are blocked. Most of the cases are the 2nd and 3rd cases, which are more difficult to troubleshoot. This happens when the sender application has written the content to the system buffer, but the system does not send it out quickly.
TCP, in order to optimize transmission efficiency (note that transmission efficiency here is not just the efficiency of a TCP connection, but the efficiency of the network as a whole), will:
-
protect the receiving end, the data sent will not exceed the buffer size of the receiving end (Flow control). Data sent to the receiving end is similar to the process described above, the kernel is responsible for receiving the packet into the buffer, and then the upper layer of applications to deal with the contents of this buffer, if the buffer at the receiving end is too small, then it is easy to bottleneck, that is, the application has not yet had time to process it is filled. Then if the data continues to be sent, the buffer cannot be stored, and the receiving end has to discard it.
-
protect the network so that the data sent does not overwhelm the network (Congestion Control), which can lead to unsatisfactory throughput in long fat pipes if there is a bottleneck in the middle network.
For receiver protection, the receiver’s buffer size (receiver window size, rwnd) is negotiated when the connection between the two sides is established, and the receiver reports its remaining and accepted window sizes in each ack packet in subsequent transmissions. This way, the sender is guaranteed not to send more data than the receiver’s buffer size when it sends. (Meaning, the sender is responsible that the total number of ack’s that the receiver does not have will not exceed the receiver’s buffer)
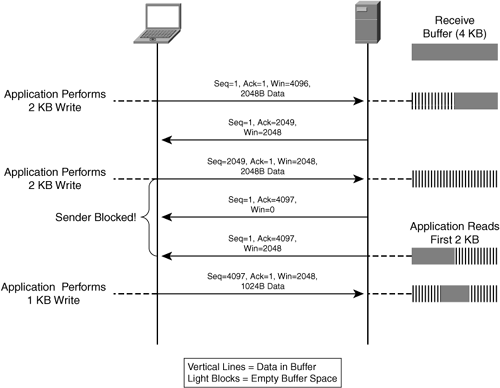
Image from cisco
For network protection, the principle is also to maintain a Window, called Congestion window, cwnd, this window is the current network limit, the sender will not send more than the capacity of this window (the total number of no ack will not exceed cwnd).
How to find the value of this cwnd?
This is the key, the default algorithm is cubic, there are other algorithms available, such as Google’s BBR.
The main logic is to slow start, send data to test, and if we receive the correct ack from the receiver, it means that the current network can accommodate the throughput, set cwnd x 2, and continue testing. Until one of the following happens.
- the packet sent does not receive the ACK
- cwnd is already equal to rwnd
The second point is well understood, which means that the network throughput is not a bottleneck, but the buffer at the receiving end is not large enough. cwnd cannot exceed rwnd, otherwise it will overload the receiving end.
For point 1, essentially, the sender uses packet loss to detect the network condition, if no packet loss occurs, it means everything is normal, if packet loss occurs, it means the network can’t handle the sending speed, then the sender will directly cut the cwnd in half.
However, the actual situation causing point 1 is not necessarily a network throughput bottleneck, but could be one of the following.
- the network has reached a bottleneck
- Packet loss due to network quality issues
- intermediate network devices delay packet delivery, resulting in the sender not receiving the ACK within the expected time
Both 2 and 3 cause a drop in cwnd, preventing full utilization of network throughput.
The above is the basic principle, and the following describes how to locate such problems.
The way to view rwnd
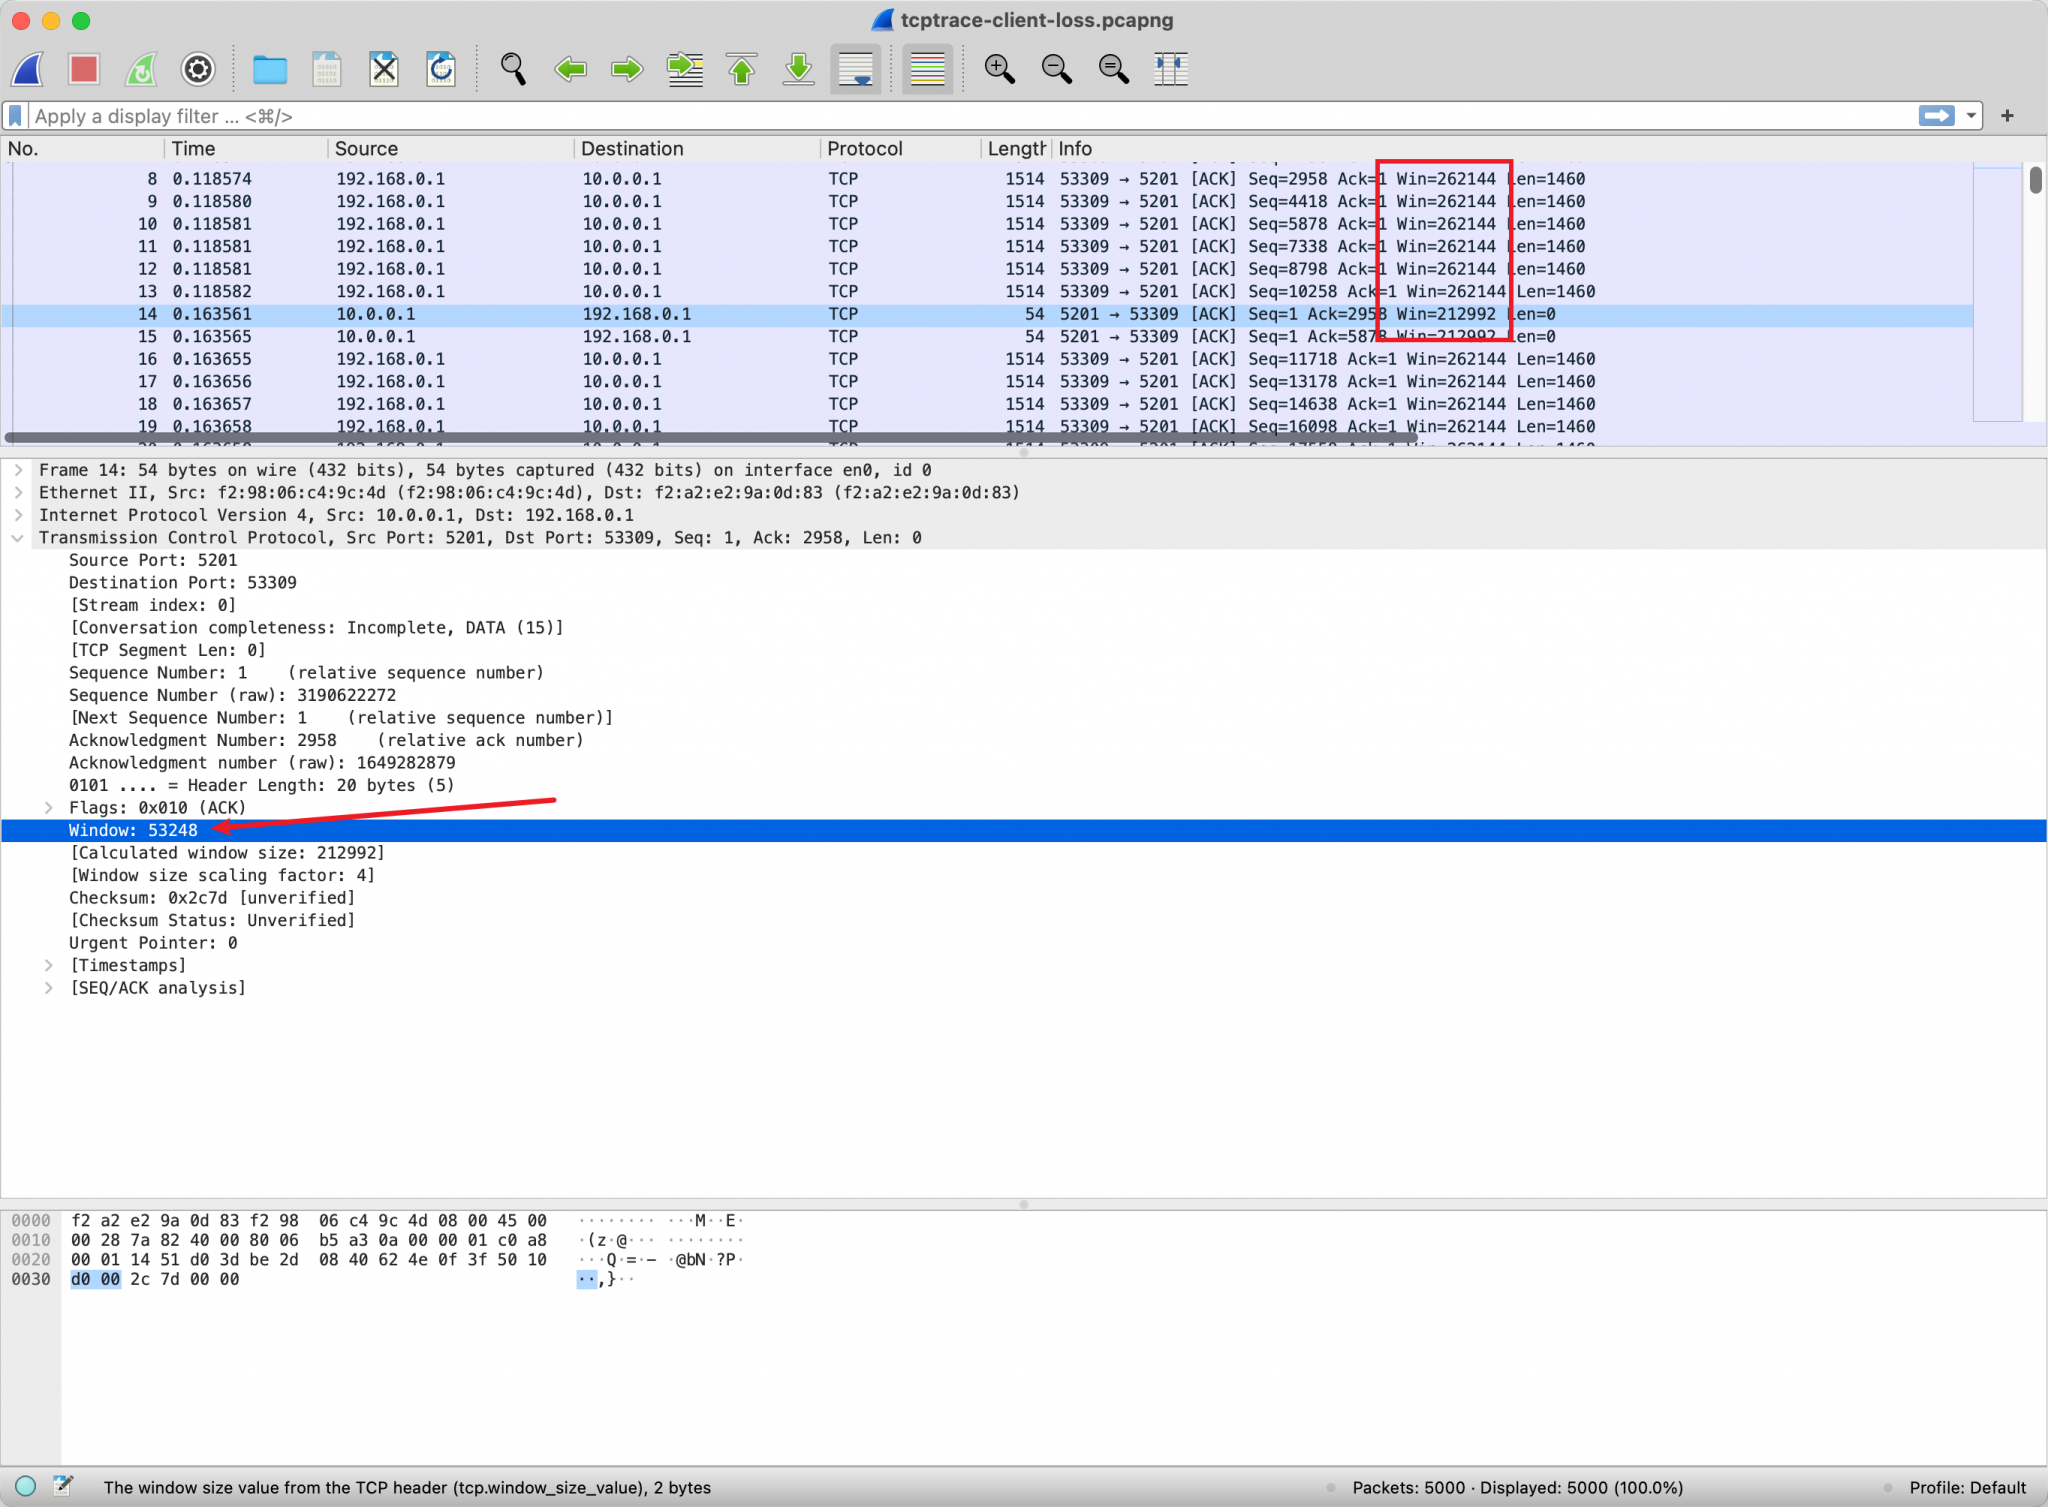
The window size is directly inside the TCP header, so you can capture it and see the field.
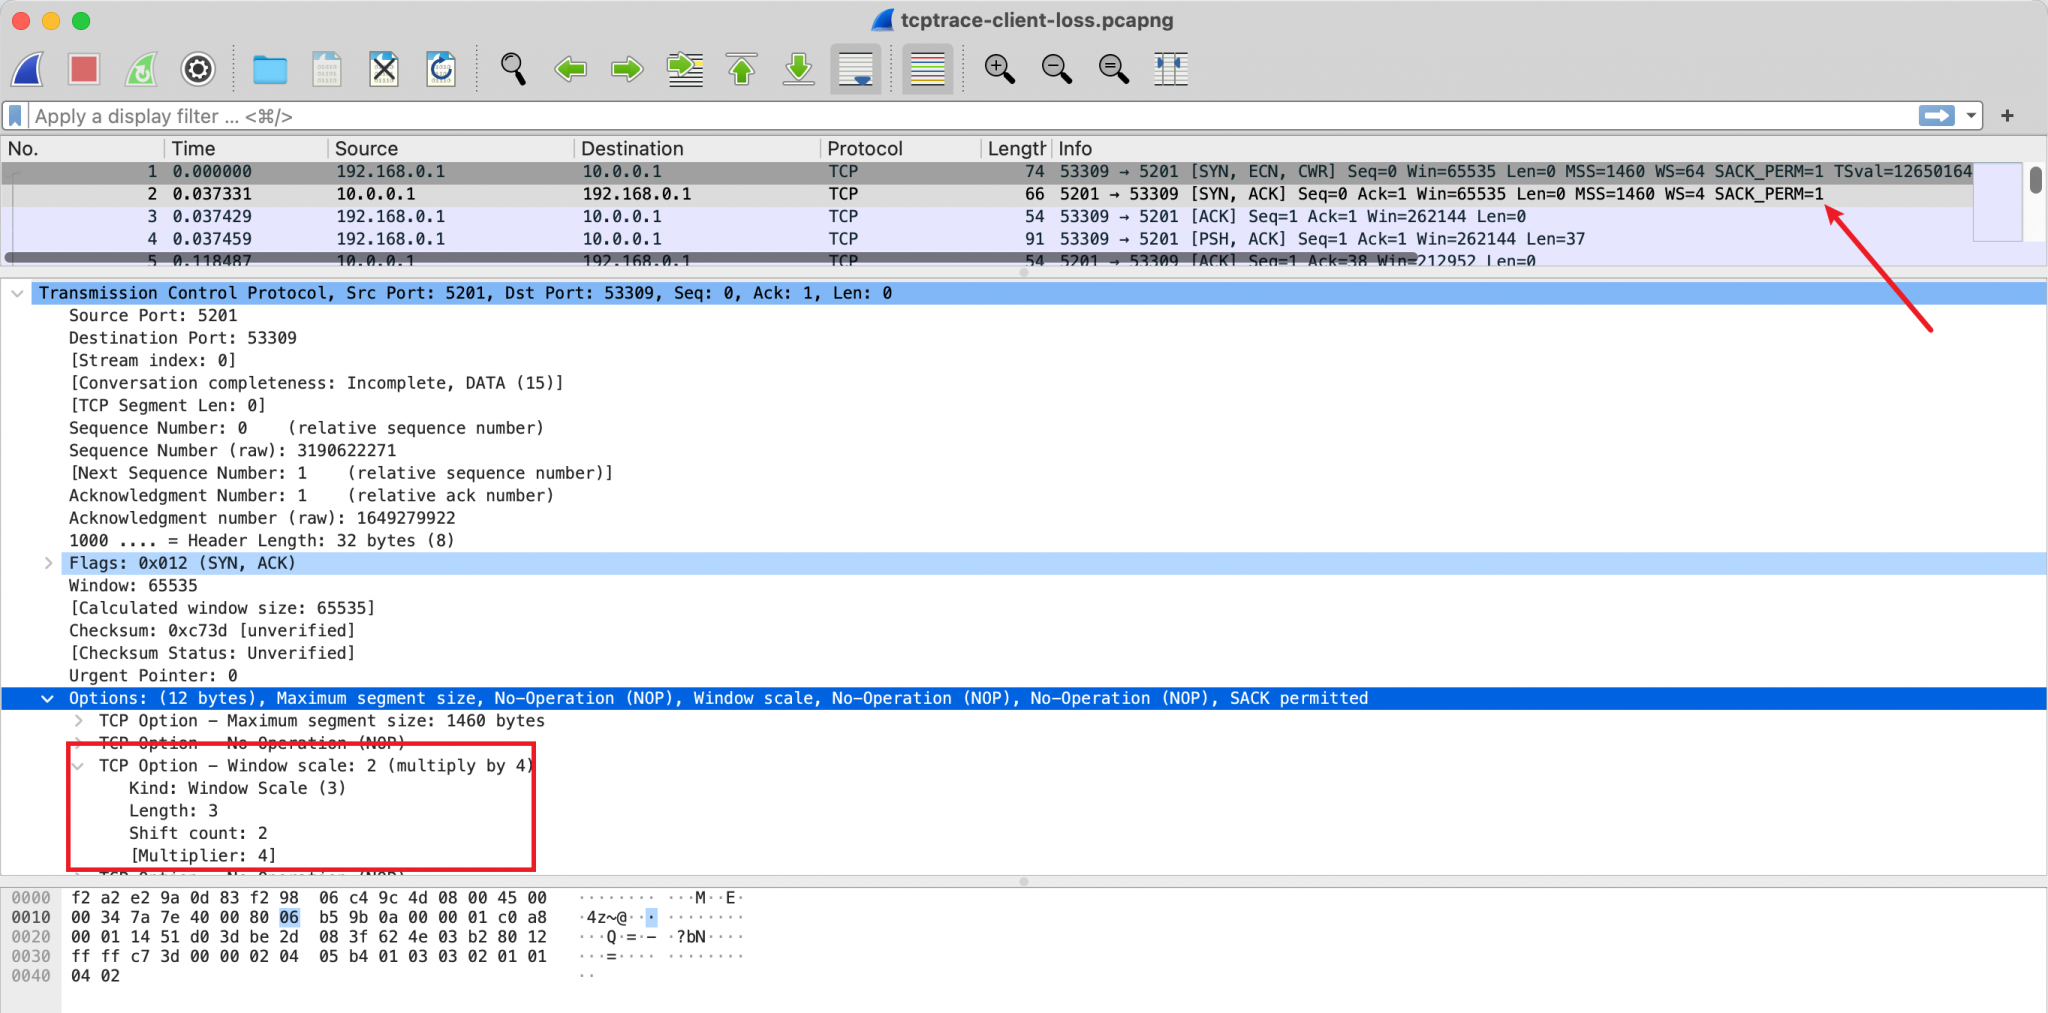
But the real window size needs to be multiplied by the factor, which is negotiated at the TCP handshake node via TCP Options. So if you analyze the window size of a TCP connection, you have to capture the packets in the handshake phase, otherwise you cannot know what the negotiated factor is.
View cwnd’s way
Congestion control is a dynamic variable obtained by an algorithm on the sender side that tries to adjust and is not reflected in the transmission data of the protocol. So to see this, you have to look at it on the sender’s machine.
In Linux you can use the ss -i option to print out all the parameters of the TCP connection.
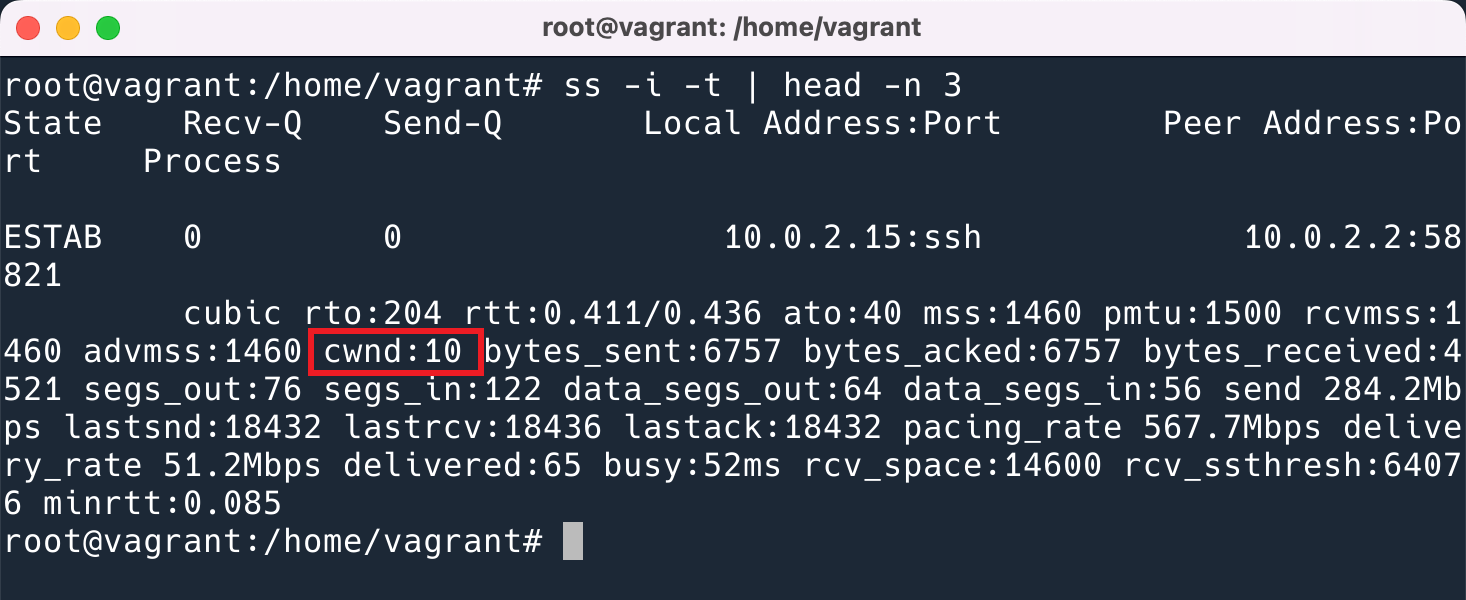
The unit shown here is TCP MSS. i.e. the actual size is 1460bytes * 10.
Analysis with Wireshark
Wireshark provides very useful statistical features that allow you to see at a glance where the current bottleneck is occurring. But the first time I opened this graph I couldn’t look at it, I was confused and didn’t find any information on how to look at it. Good thing my colleague will, he taught me, I’m here to record, to teach you too.
First of all, the way to open it is as follows.
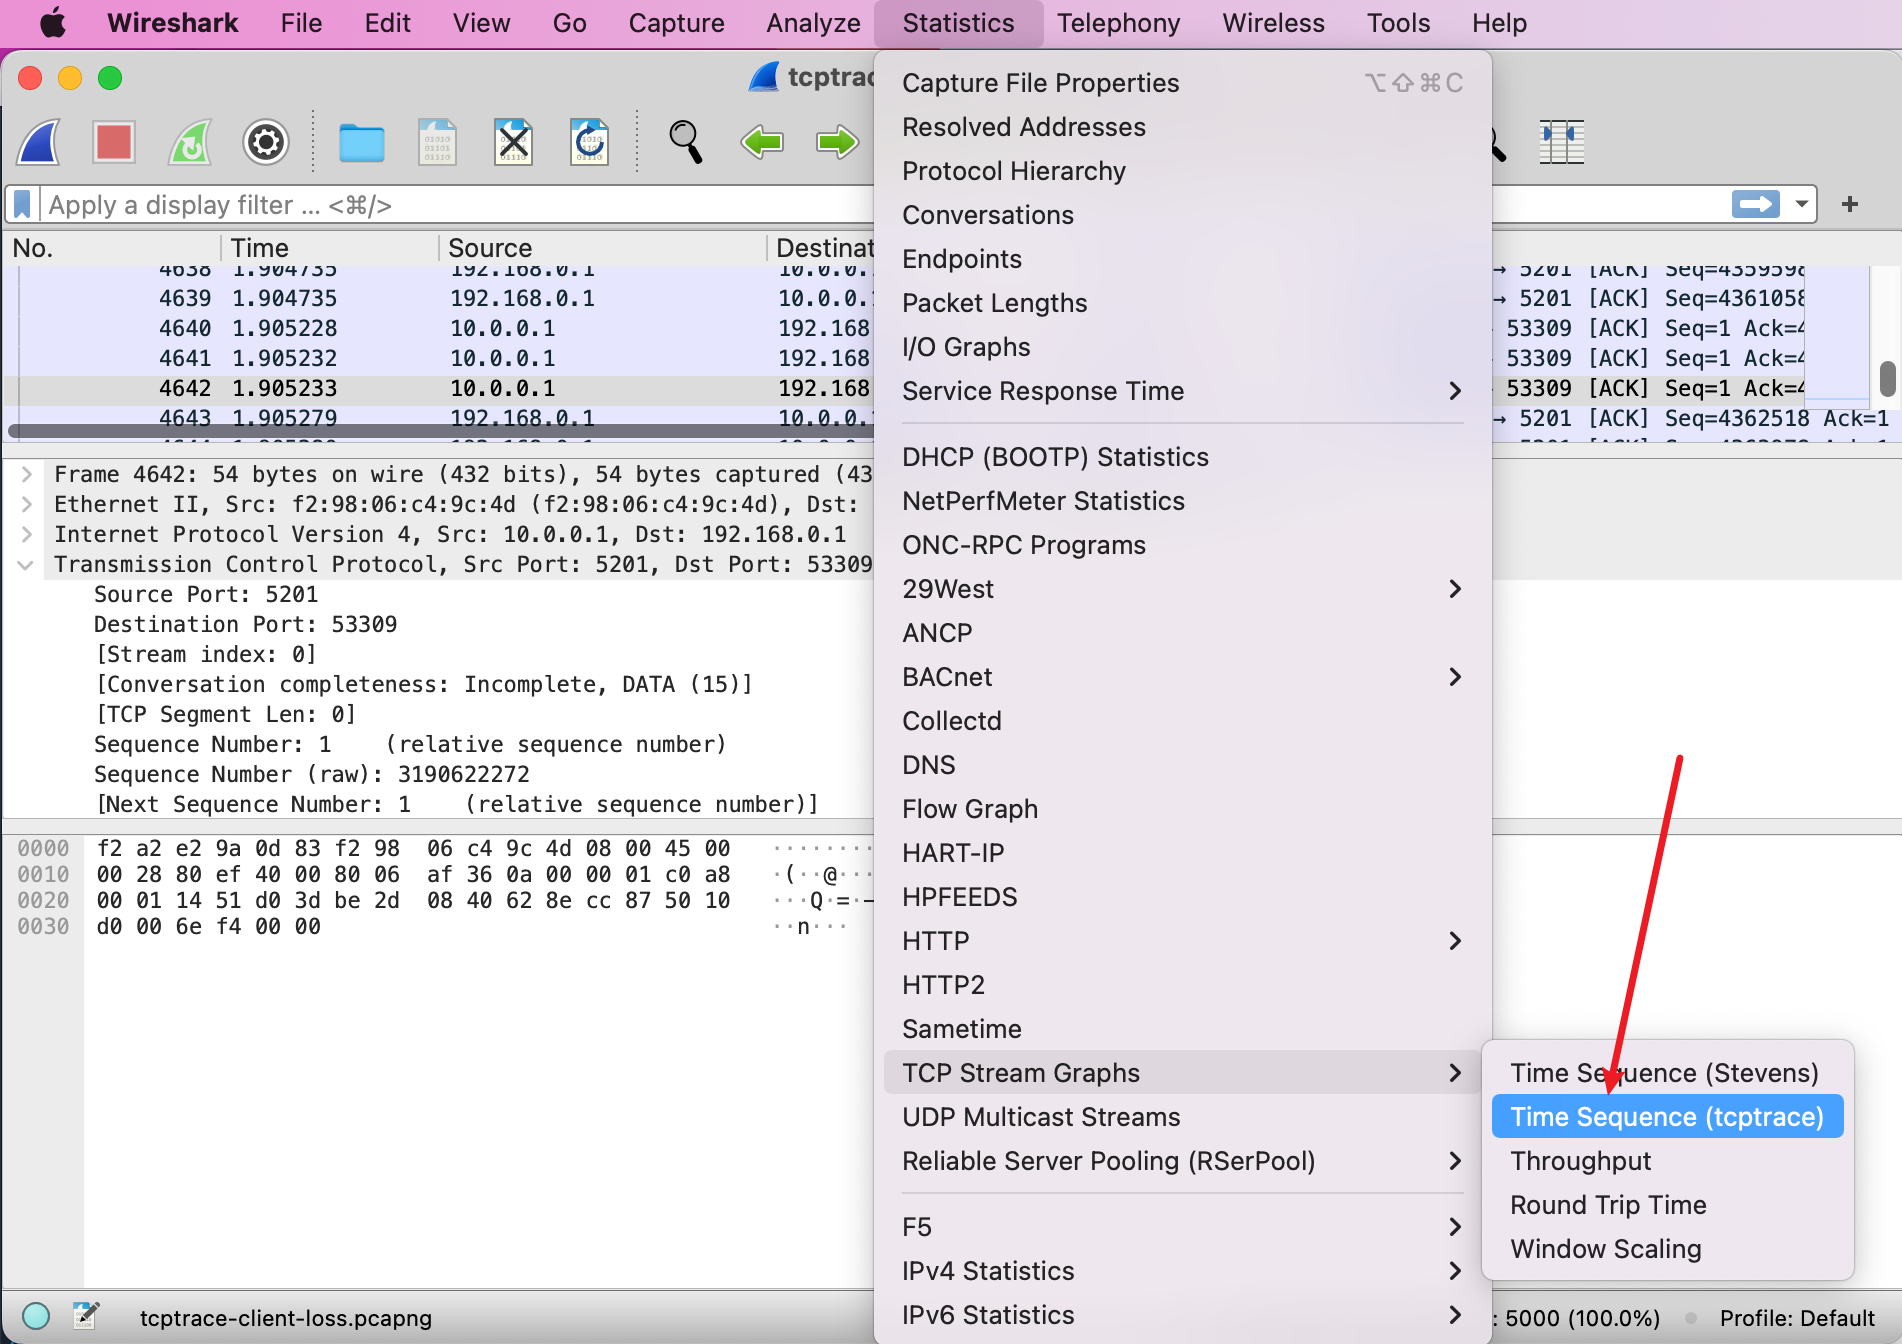
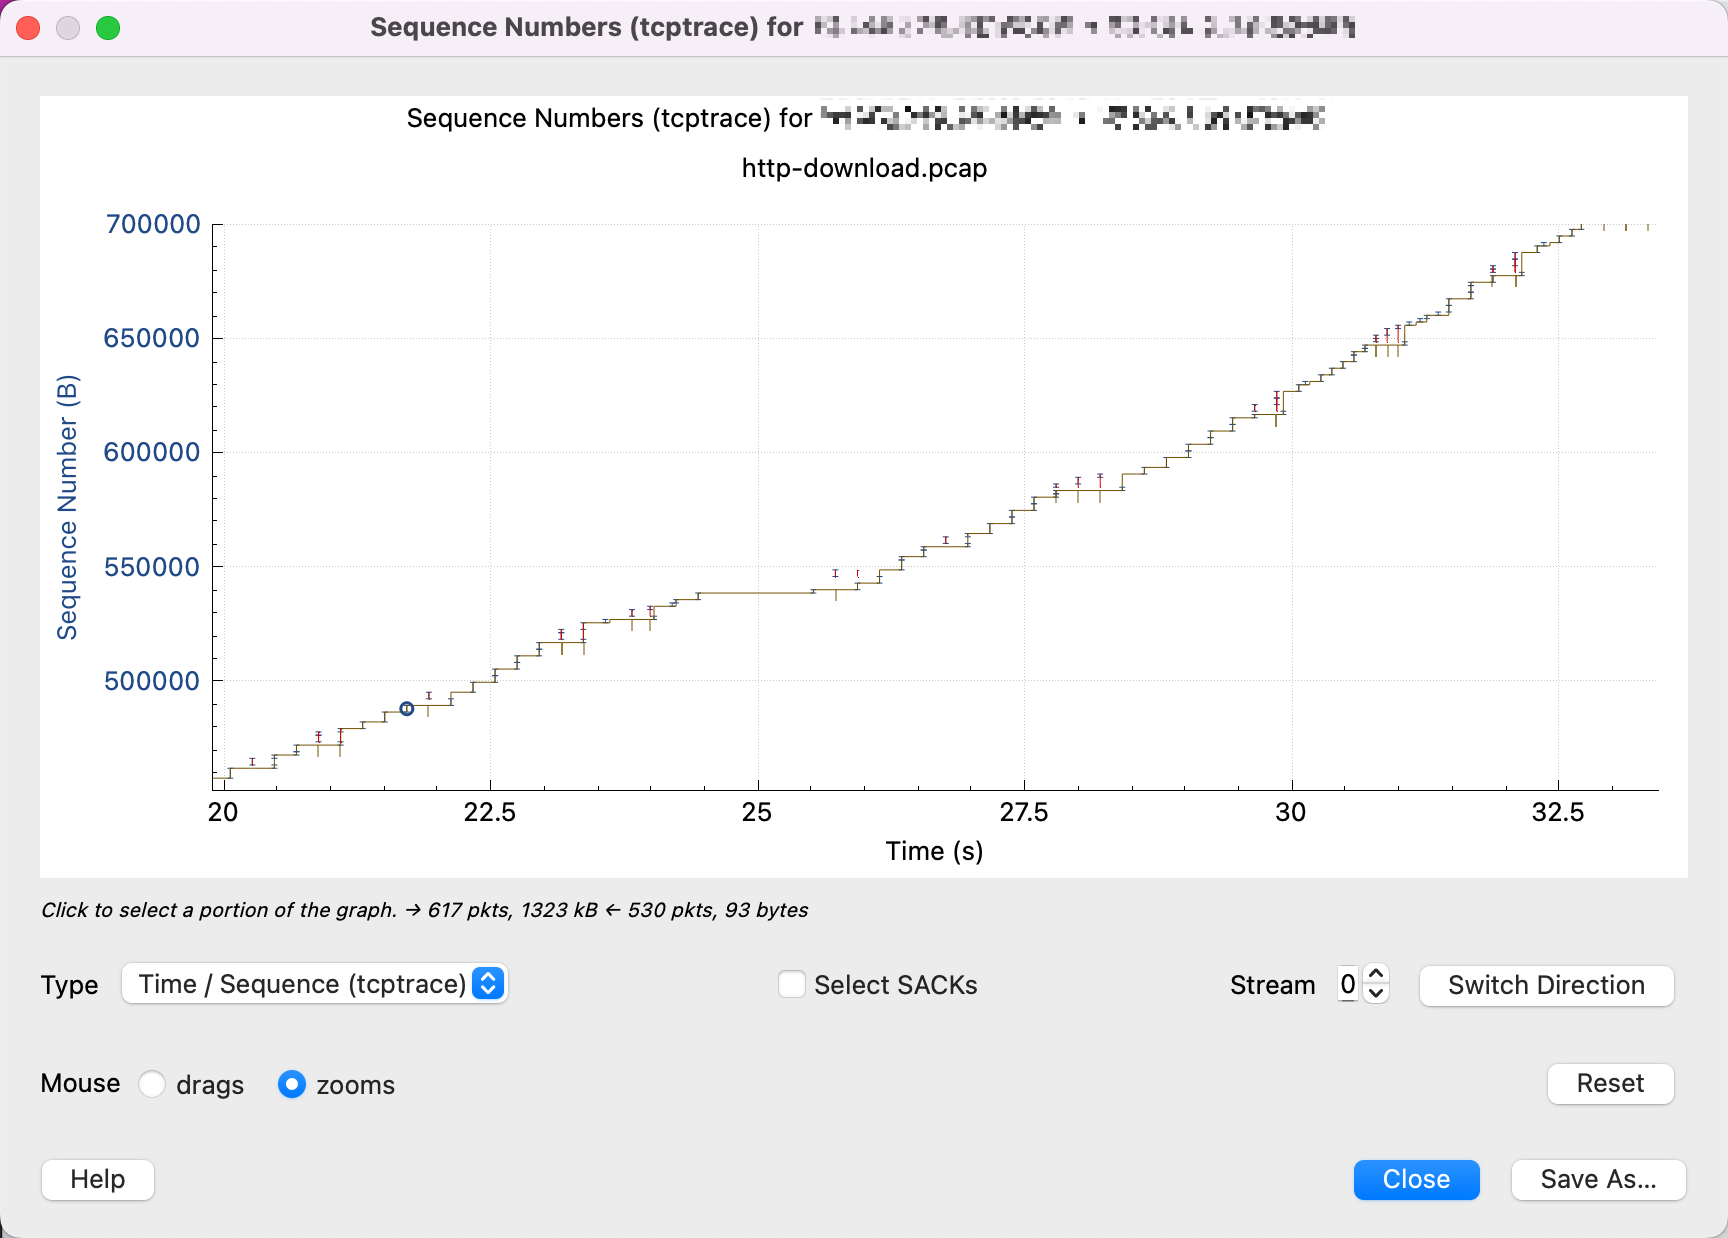
Then you will see the following diagram.
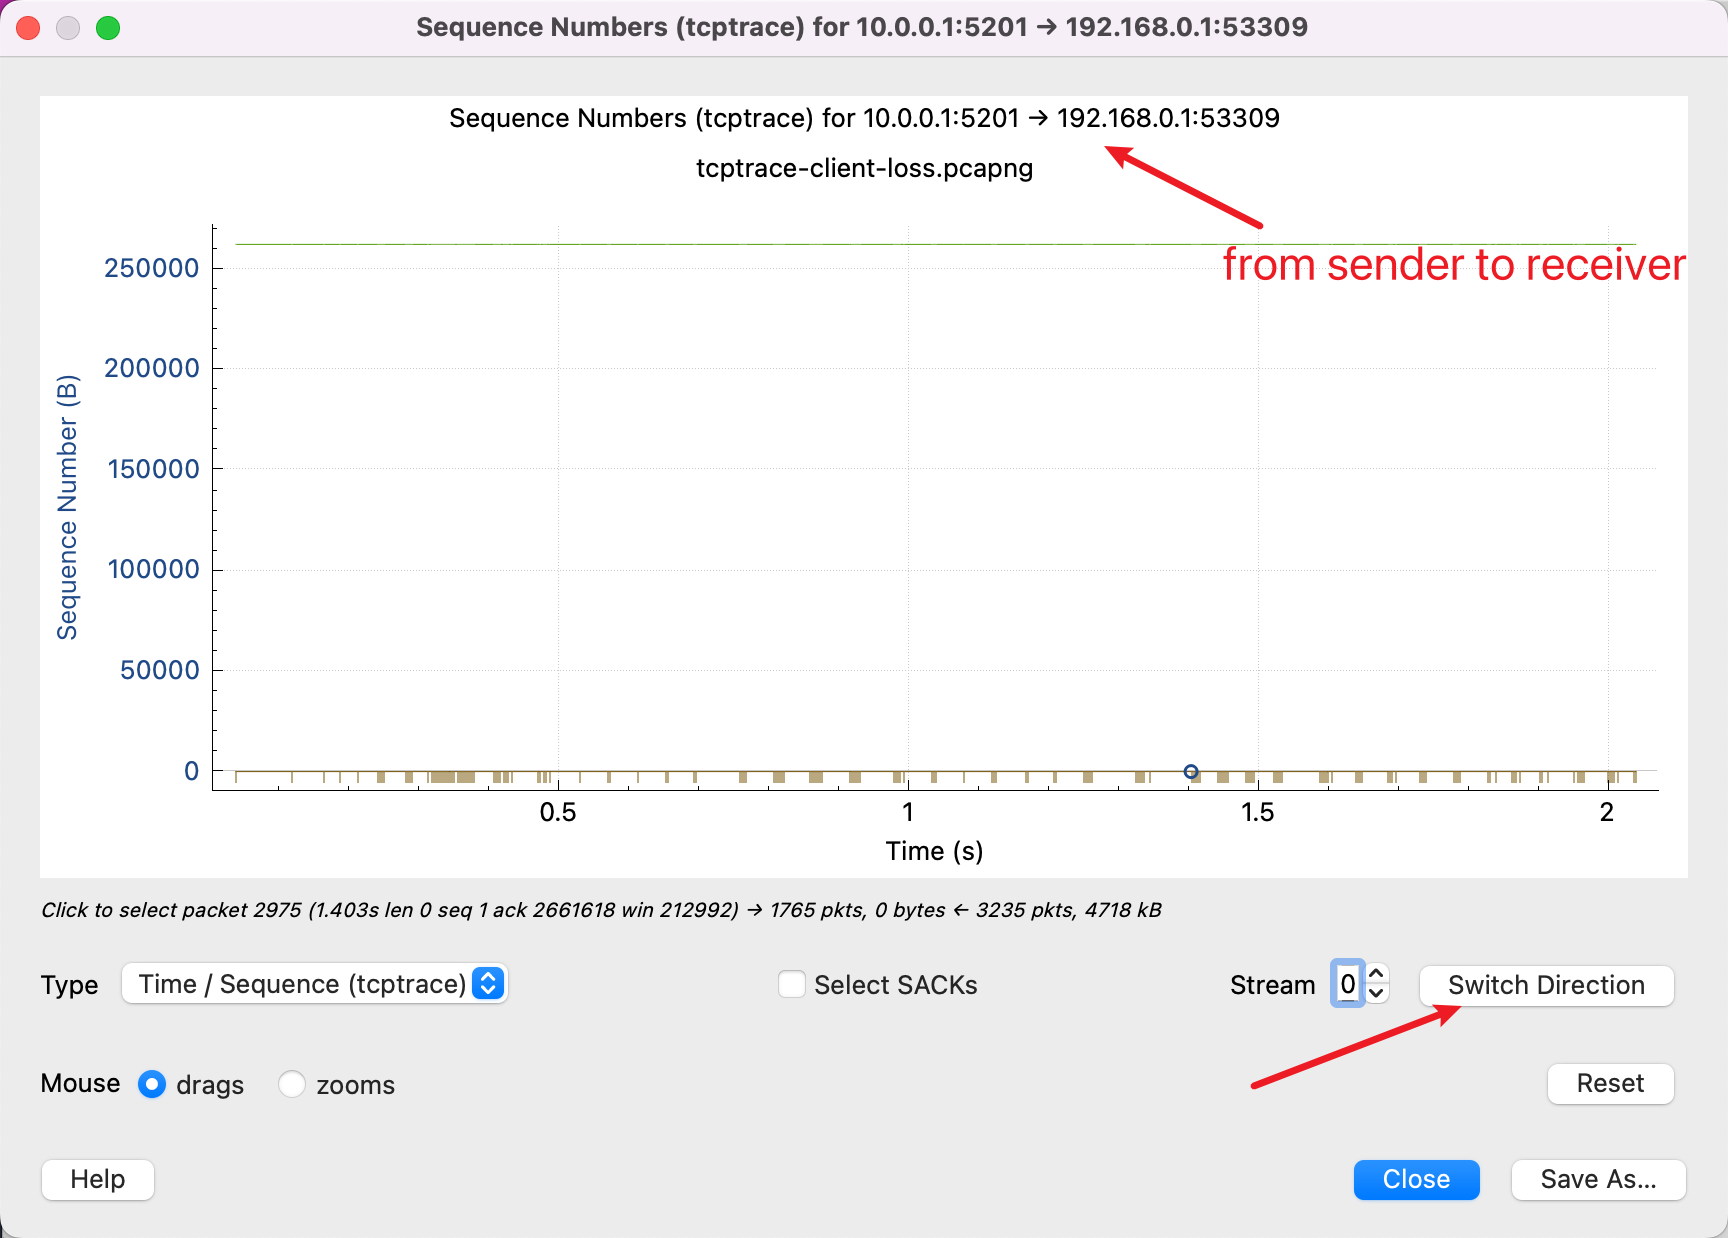
First of all, it should be clear that the tcptrace diagram indicates that the data is sent in one direction, because tcp is a duplex protocol, both sides can send data. Which is written at the top of the graph you are currently watching data sent from 10.0.0.1 to 192.168.0.1, and then press the button in the lower right corner to switch the direction of viewing.
The X-axis is the time, which is well understood.
Then understand the Sequence Number on the Y-axis, which is the Sequence Number in the TCP packet, which is critical. All the data in the diagram is based on Sequence Number.
So, if you see the above diagram, then it means that you are looking at it backwards, because the Sequence Number of the data has not increased, which means that almost no data has been sent, and you need to click Switch Direction.

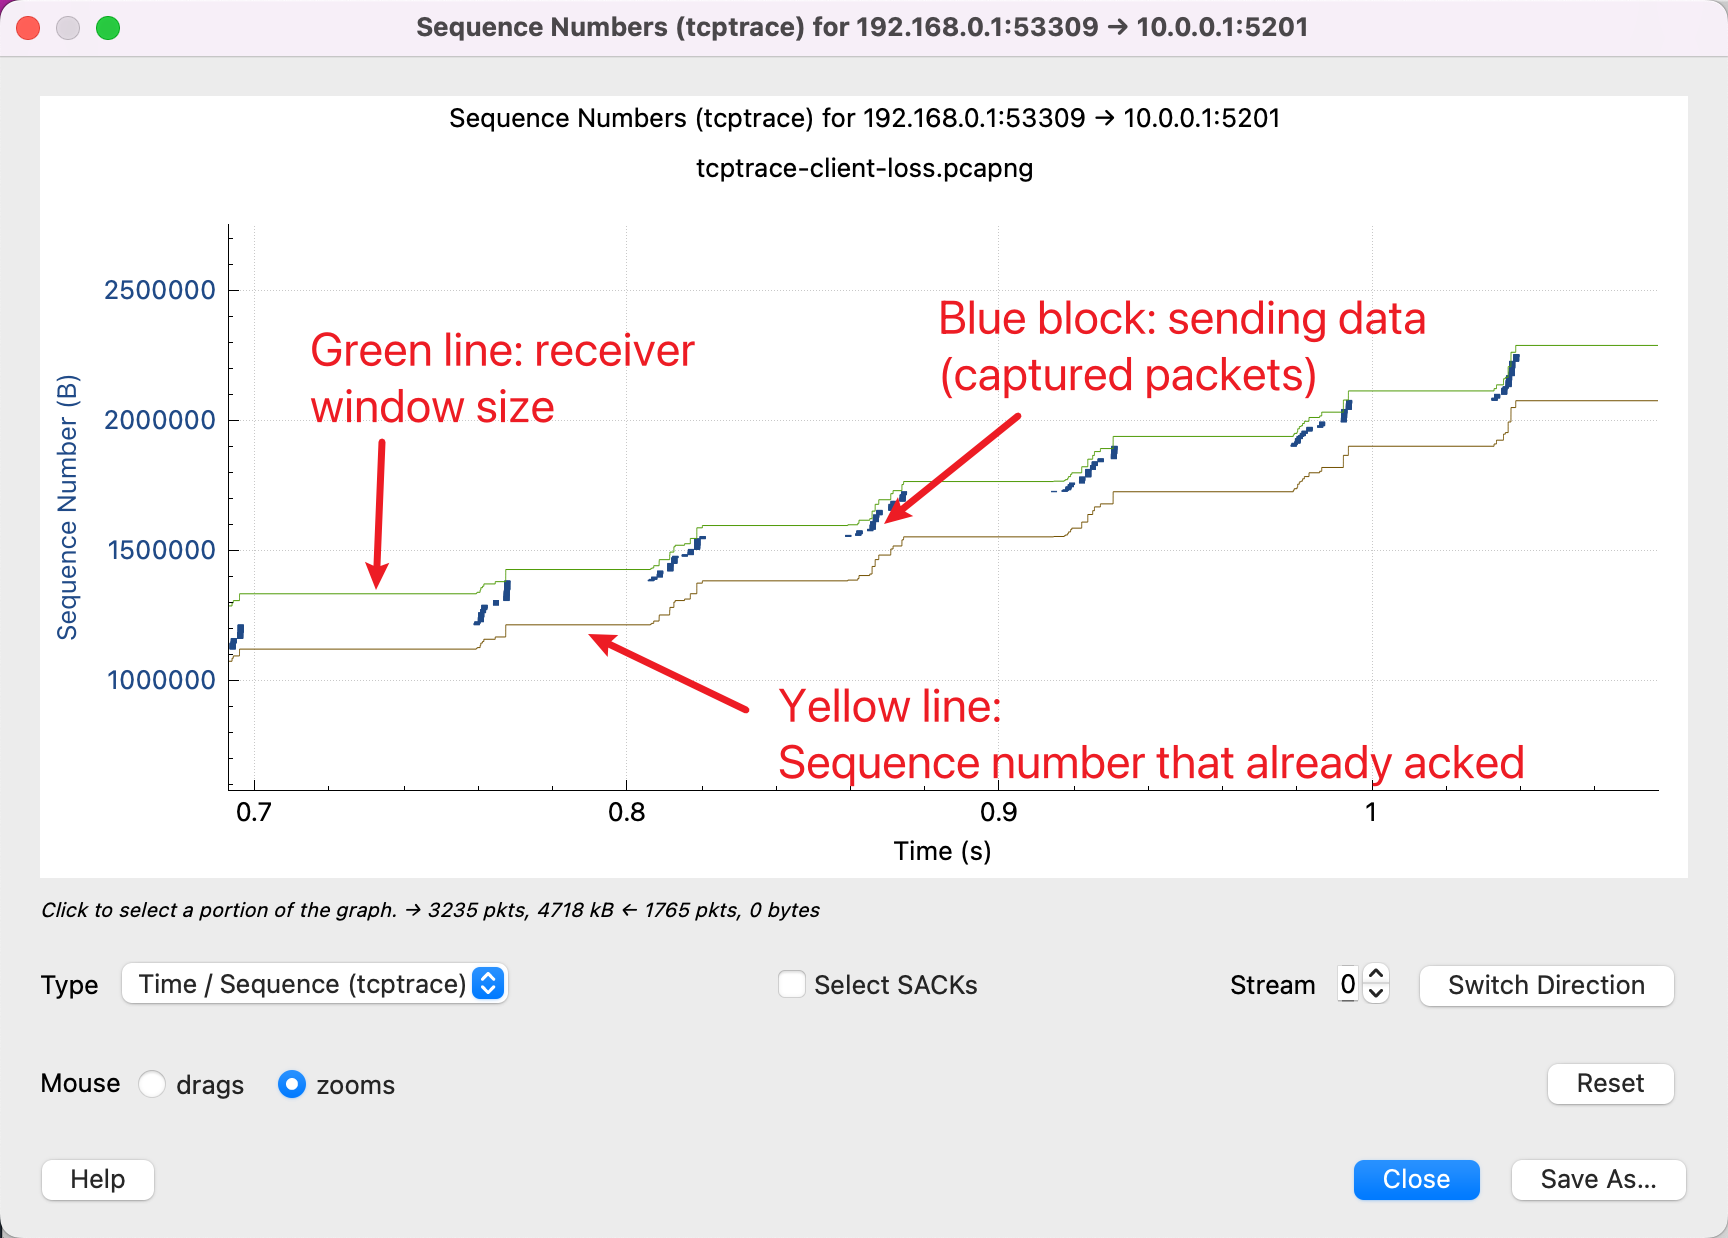
That’s right, you can see that the Sequence Number of our transfer is increasing with time.
There are 3 lines here, with the following meaning.
In addition to this, there are two other lines.
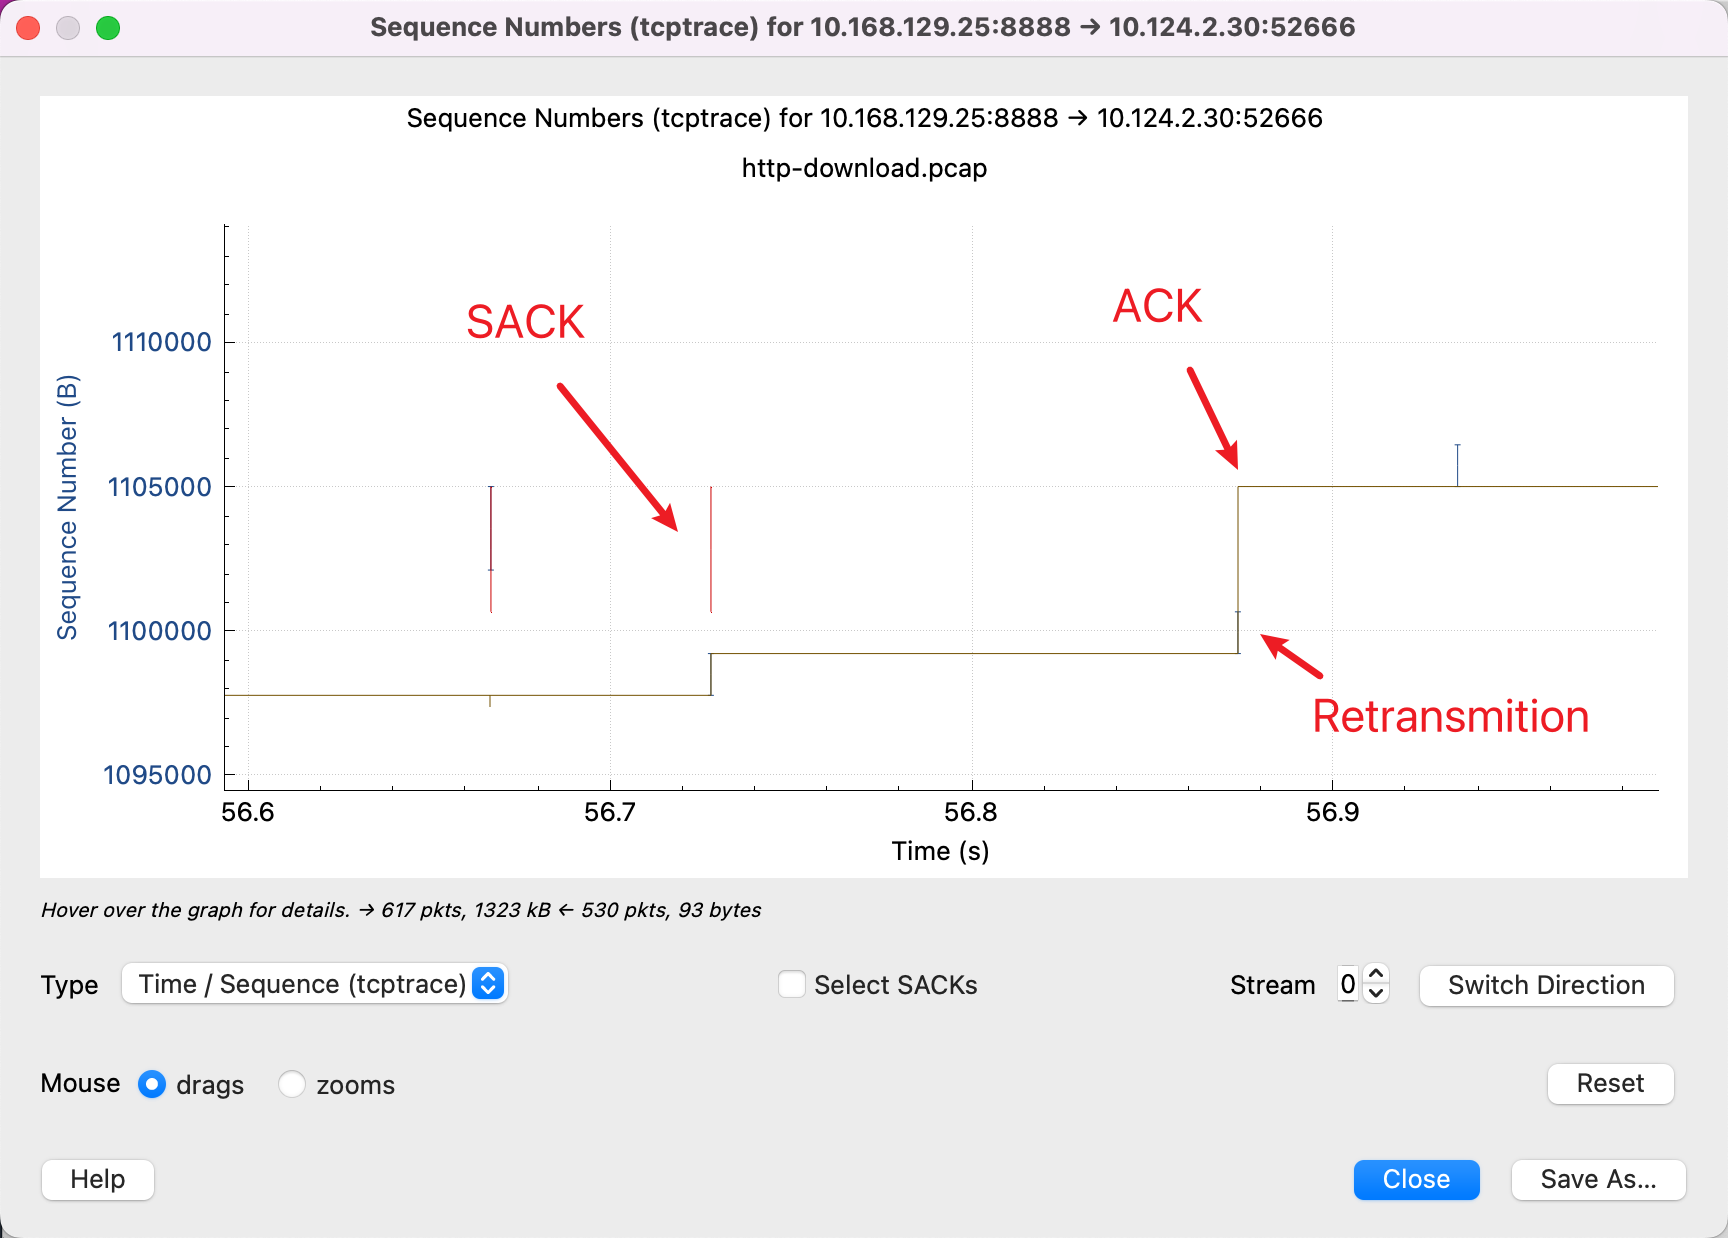
What we need to always remember is that the Y-axis is the Sequence Number, the red line indicates the SACK line means that this section of the Sequence Number I have received, and then with the yellow line indicates the ACK over the Sequence Number, then the sender will know that in the middle of this gap, the packet is lost, the red line and the yellow line vertical gap, is The packet that has not been ACKed. So, it needs to be retransmitted. And the blue line means that it was retransmitted again.
After learning to look at these diagrams, we can recognize several common patterns.
Packet loss
Many red SACKs, indicating that the receiver side is repeatedly saying: there is a packet in the middle I did not receive, there is a packet in the middle I did not receive.
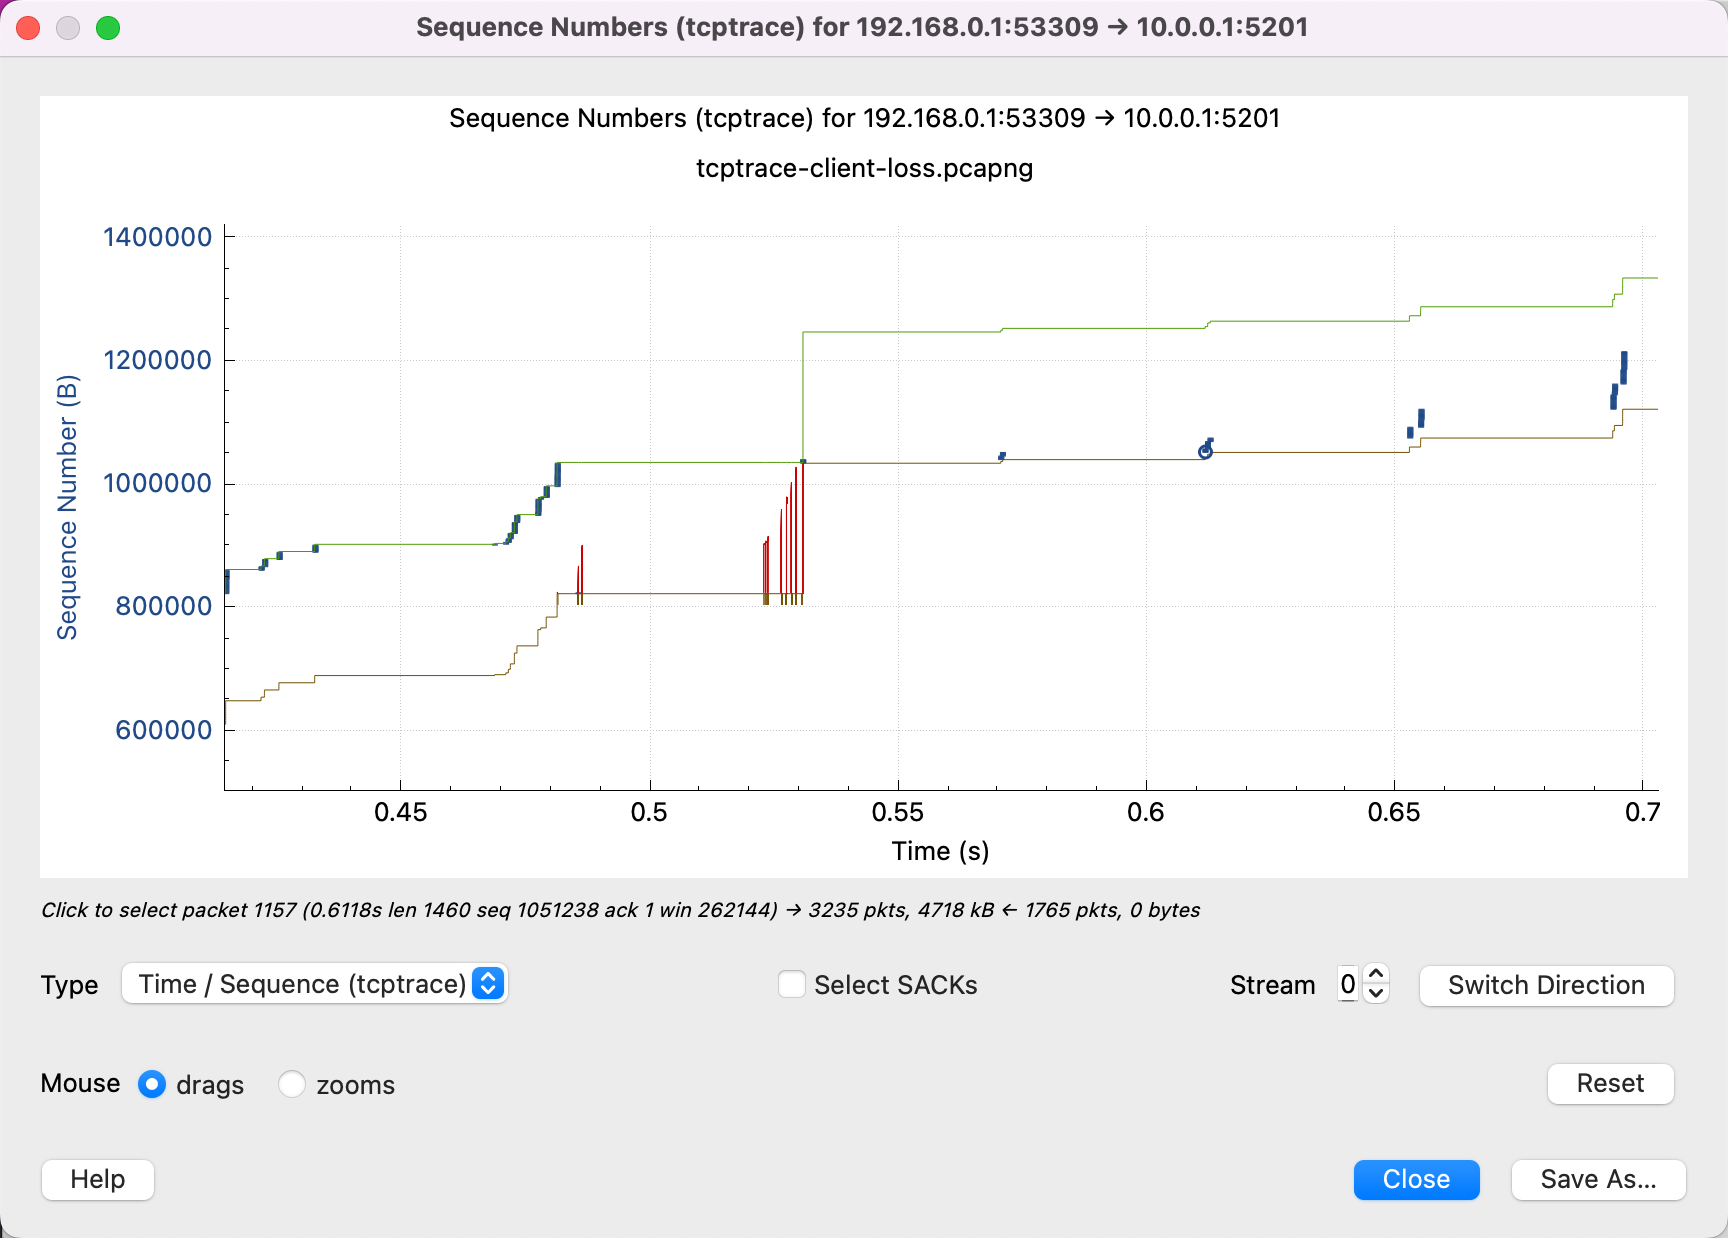
Throughput is limited by receive window size
From this graph, we can see that once the yellow line (ACK on the receiver side) rises, the blue line follows (the sender side starts sending) until the green line (window size) is filled. This means that the network is not a bottleneck and the buffer size at the receiving end can be adjusted to a larger size.
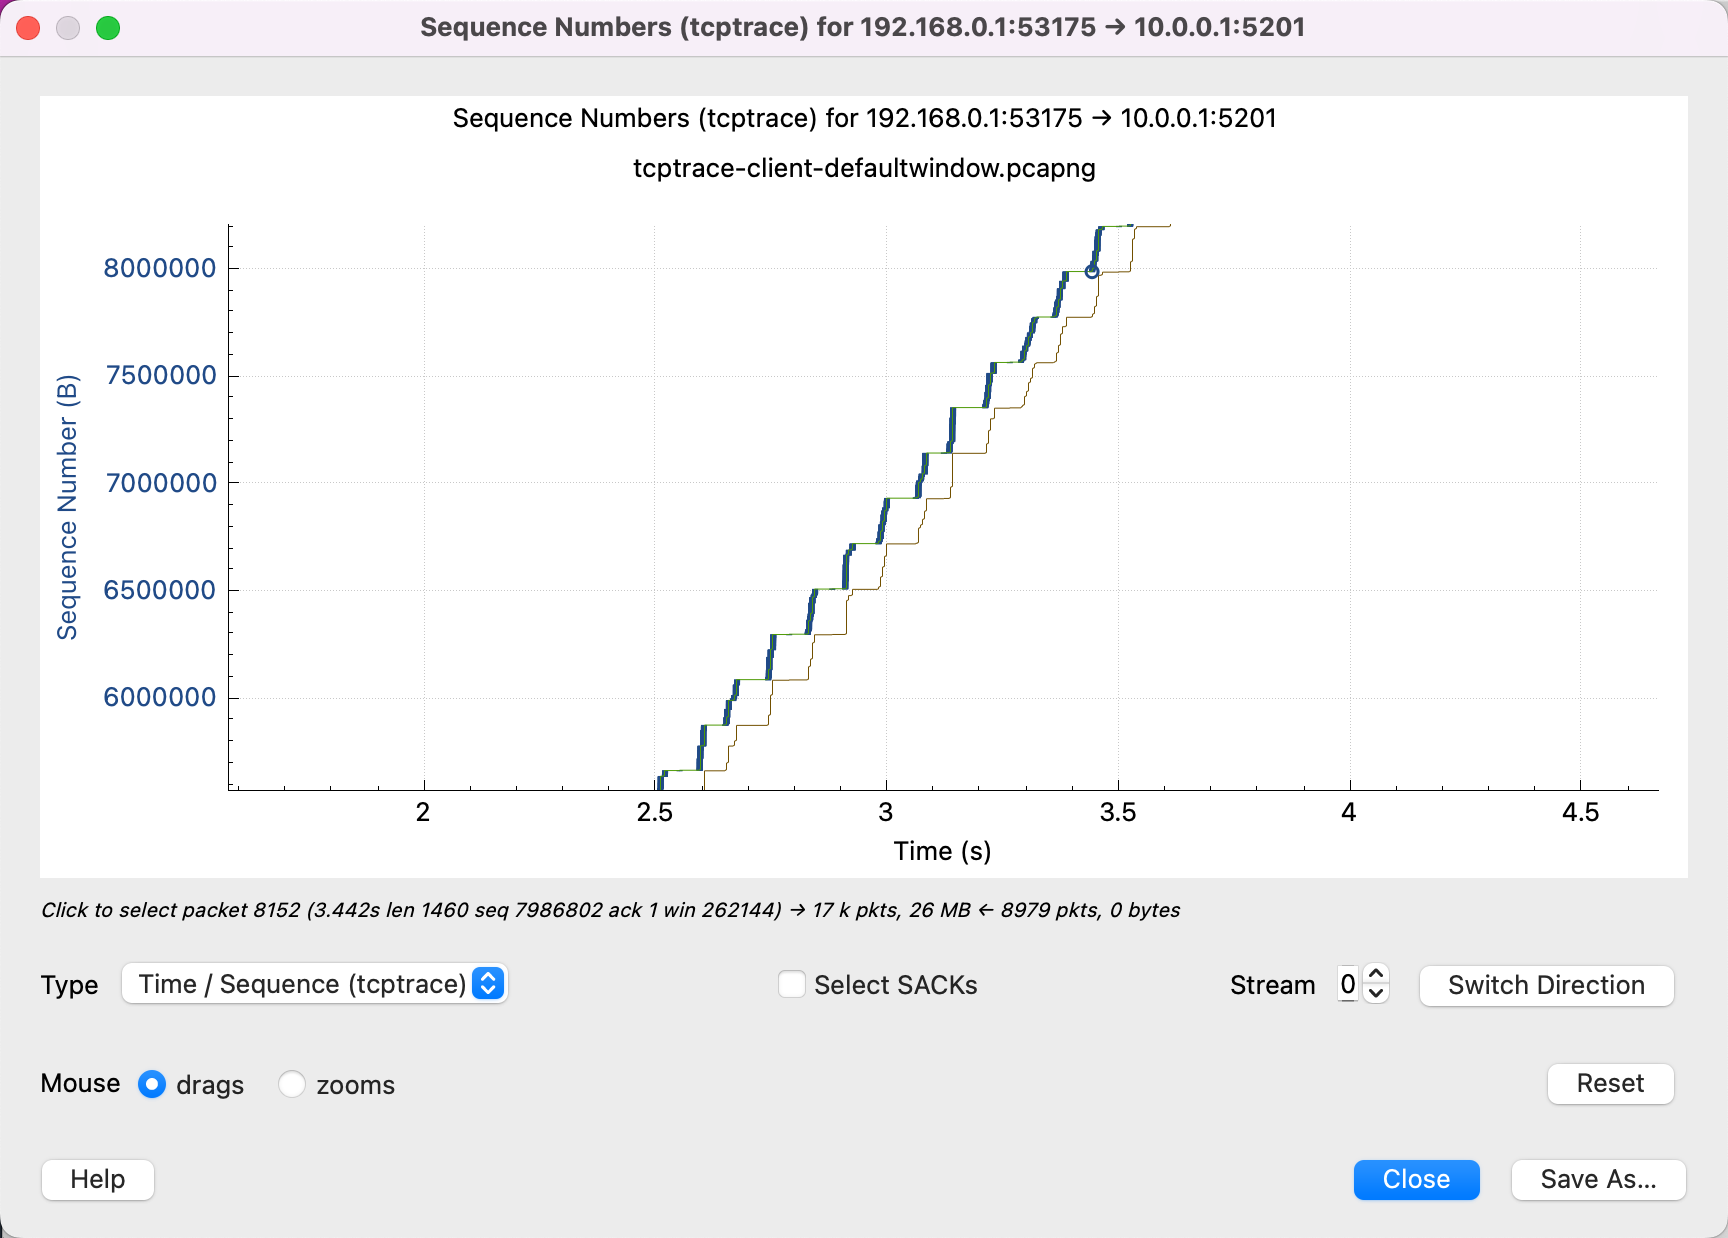
Throughput is limited by network quality
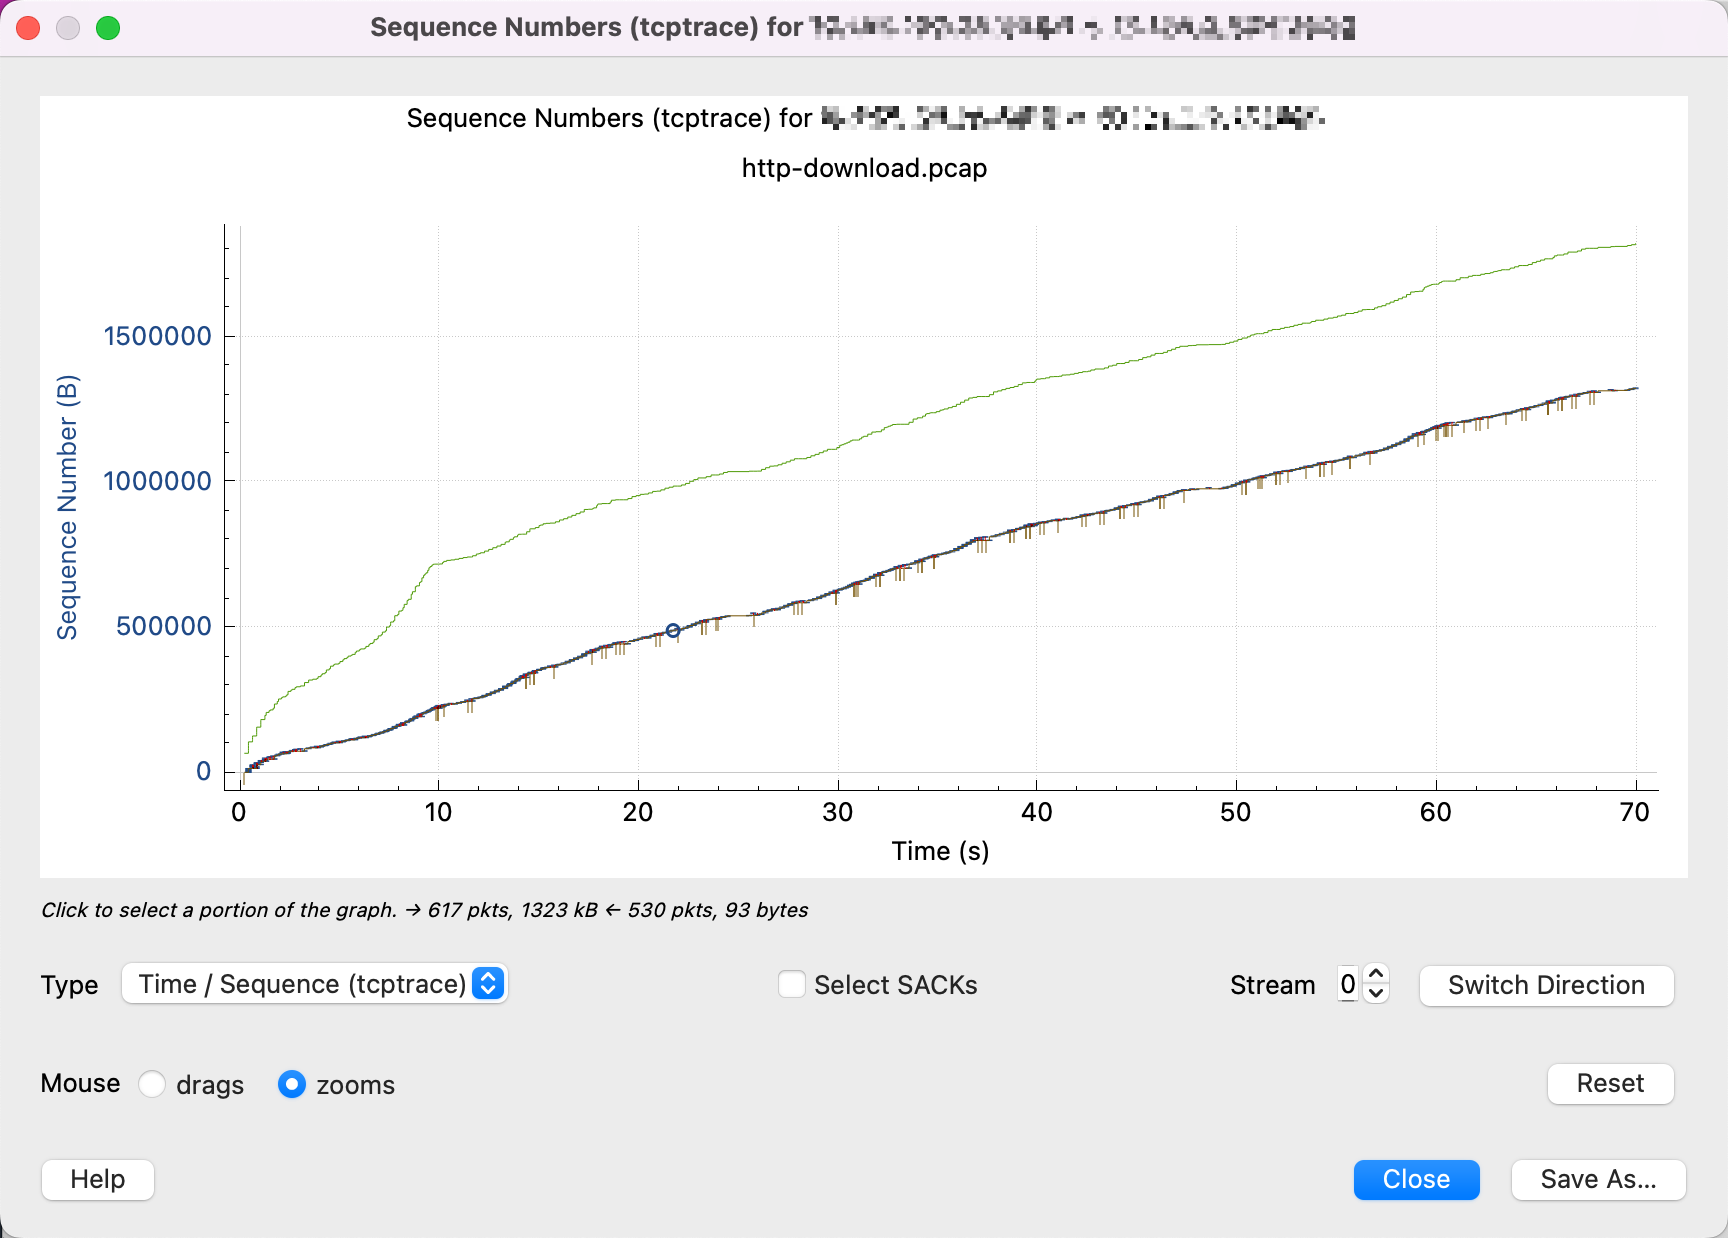
As you can see from this diagram, the window size on the receiving end is far from being a bottleneck, and there is still a lot of free space.
Zooming in shows that there are many packet drops and retransmissions in between, and that only a little bit of data is sent at a time, indicating that most likely the cwnd is too small and is limited by the congestion control algorithm.
The packet capture file used in this article can be downloaded from here (credit: https://www.youtube.com/watch?v=yUmACeSmT7o):
Some additional references.
- https://www.stackpath.com/edge-academy/what-is-cwnd-and-rwnd/
- https://www.baeldung.com/cs/tcp-flow-control-vs-congestion-control
- https://www.cs.cornell.edu/courses/cs4450/2020sp/lecture21-congestion-control.pdf
- https://www.mi.fu-berlin.de/inf/groups/ag-tech/teaching/2011-12_WS/L_19531_Telematics/08_Transport_Layer.pdf
- https://wiki.aalto.fi/download/attachments/69901948/TCP-CongestionControlFinal.pdf
- https://paulgrevink.wordpress.com/2017/09/08/about-long-fat-networks-and-tcp-tuning/