I recently had a requirement to collect extranet access to Kubernetes. Therefore, we have investigated and tried out related projects, and this post focuses on how to install Kindling and configure Grafana to view Kubernetes network connection data.
1. What is Kindling
There are currently two versions of Kindling, an open source version and a commercial version. The open source version, which collects data in insufficient detail and can only be observed through Grafana, and the commercial version, which has enhanced functionality, are described on the project’s Github home page and will not be repeated here.
This eBPF-based technique of converting kernel function calls into userspace events and then exposing them to user programs should be interesting in the coming years. Here’s a simple deployment, using the open source version of Kindling.
2. Installing Kindling
The Kindling open source community is not very well run, and the documentation and materials are not clear enough. I’ve put together a yml for installation.
2.1 Make sure the kernel version is greater than 4.14
2.2 Downloading Yaml files
2.3 Installing Kindling
|
|
2.4 Viewing Pod Status
|
|
2.5 Pods may keep CrashLoopBackOff
Pod keeps CrashLoopBackOff, which is caused by a mismatch between the kindling-agent image and the current system. You need to recompile the image.
-
Install kernel headers
Ubuntu Execute the following command.
1apt-get -y install linux-headers-$(uname -r)CentOs executes the following command.
1yum -y install kernel-devel-$(uname -r) -
Compile and generate a new image
1bash -c "$(curl -fsSL https://k8s-bpf-probes-public.oss-cn-hangzhou.aliyuncs.com/recompile-module.sh)" -
Tag the image to the image defined in Yaml
1docker tag kindlingproject/kindling-agent:bymyself shaowenchen/kindling-agent:ubuntu-20.04 -
Restart the Pod and you’re done!
1kubeclt -n kindling delete pod kindling-agent-xxx -
Tips for replacing kindling-agent images
You need to change the mirror pull policy of the kindling-agent to IfNotPresent.
1imagePullPolicy: IfNotPresent
Note here that if your infrastructure is relatively uniform, with only one OS and one kernel version, then you can tag the image as your own private image and push it to the remote end by modifying the kindling-agent Daemonset image address.
If your infrastructure is not uniform, and a cluster contains multiple hosts, multiple operating systems, and multiple kernel versions, then you can compile on each of these special systems. Since Daemonset can only set one image name, you need to keep the name of the kindling-agent image consistent across all Kubernetes nodes recompiled.
3. Installing the Grafana Plugin and Importing the Panel
3.1 Installing the topo-plugin plugin
Since Grafana, which I commonly use, is deployed using Docker, installing the plugin is a bit complicated.
-
Download the plugin
-
Copy the plugin into the container
1docker cp topo-plugin.tar.gz 392fe26ae57f:/var/lib/grafana/plugins/where 392fe26ae57f is the container ID of the Grafana run.
-
Enter the container creation directory
1docker exec -it 392fe26ae57f sh -
In the container, create a directory to decompress the plugin
-
Configuration plug-in
/etc/grafana/grafana.iniis a read-only file, so it needs to be copied outside the container, modified, and then copied to overwrite the original file.1docker cp 392fe26ae57f:/etc/grafana/grafana.ini grafana.iniEdit the
grafana.inifile locally and add the following.Copy the modified
grafana.inifile back to the container to overwrite the original file.1docker cp grafana.ini 392fe26ae57f:/etc/grafana/grafana.ini -
Restart Grafana
1docker restart 392fe26ae57f
3.2 Importing Grafana Panels
I am using Grafana version 8.3.1.
The relevant Dashboard Json file is backed up at https://github.com/shaowenchen/demo/tree/master/kindling/dashboard.
Compared to the official Dashboard provided by Kindling, the DataSource field has been added to switch the data source, making it easier to view monitoring data on different clusters.
4. View the data reported by the kindling-agent
Here is the screenshot.
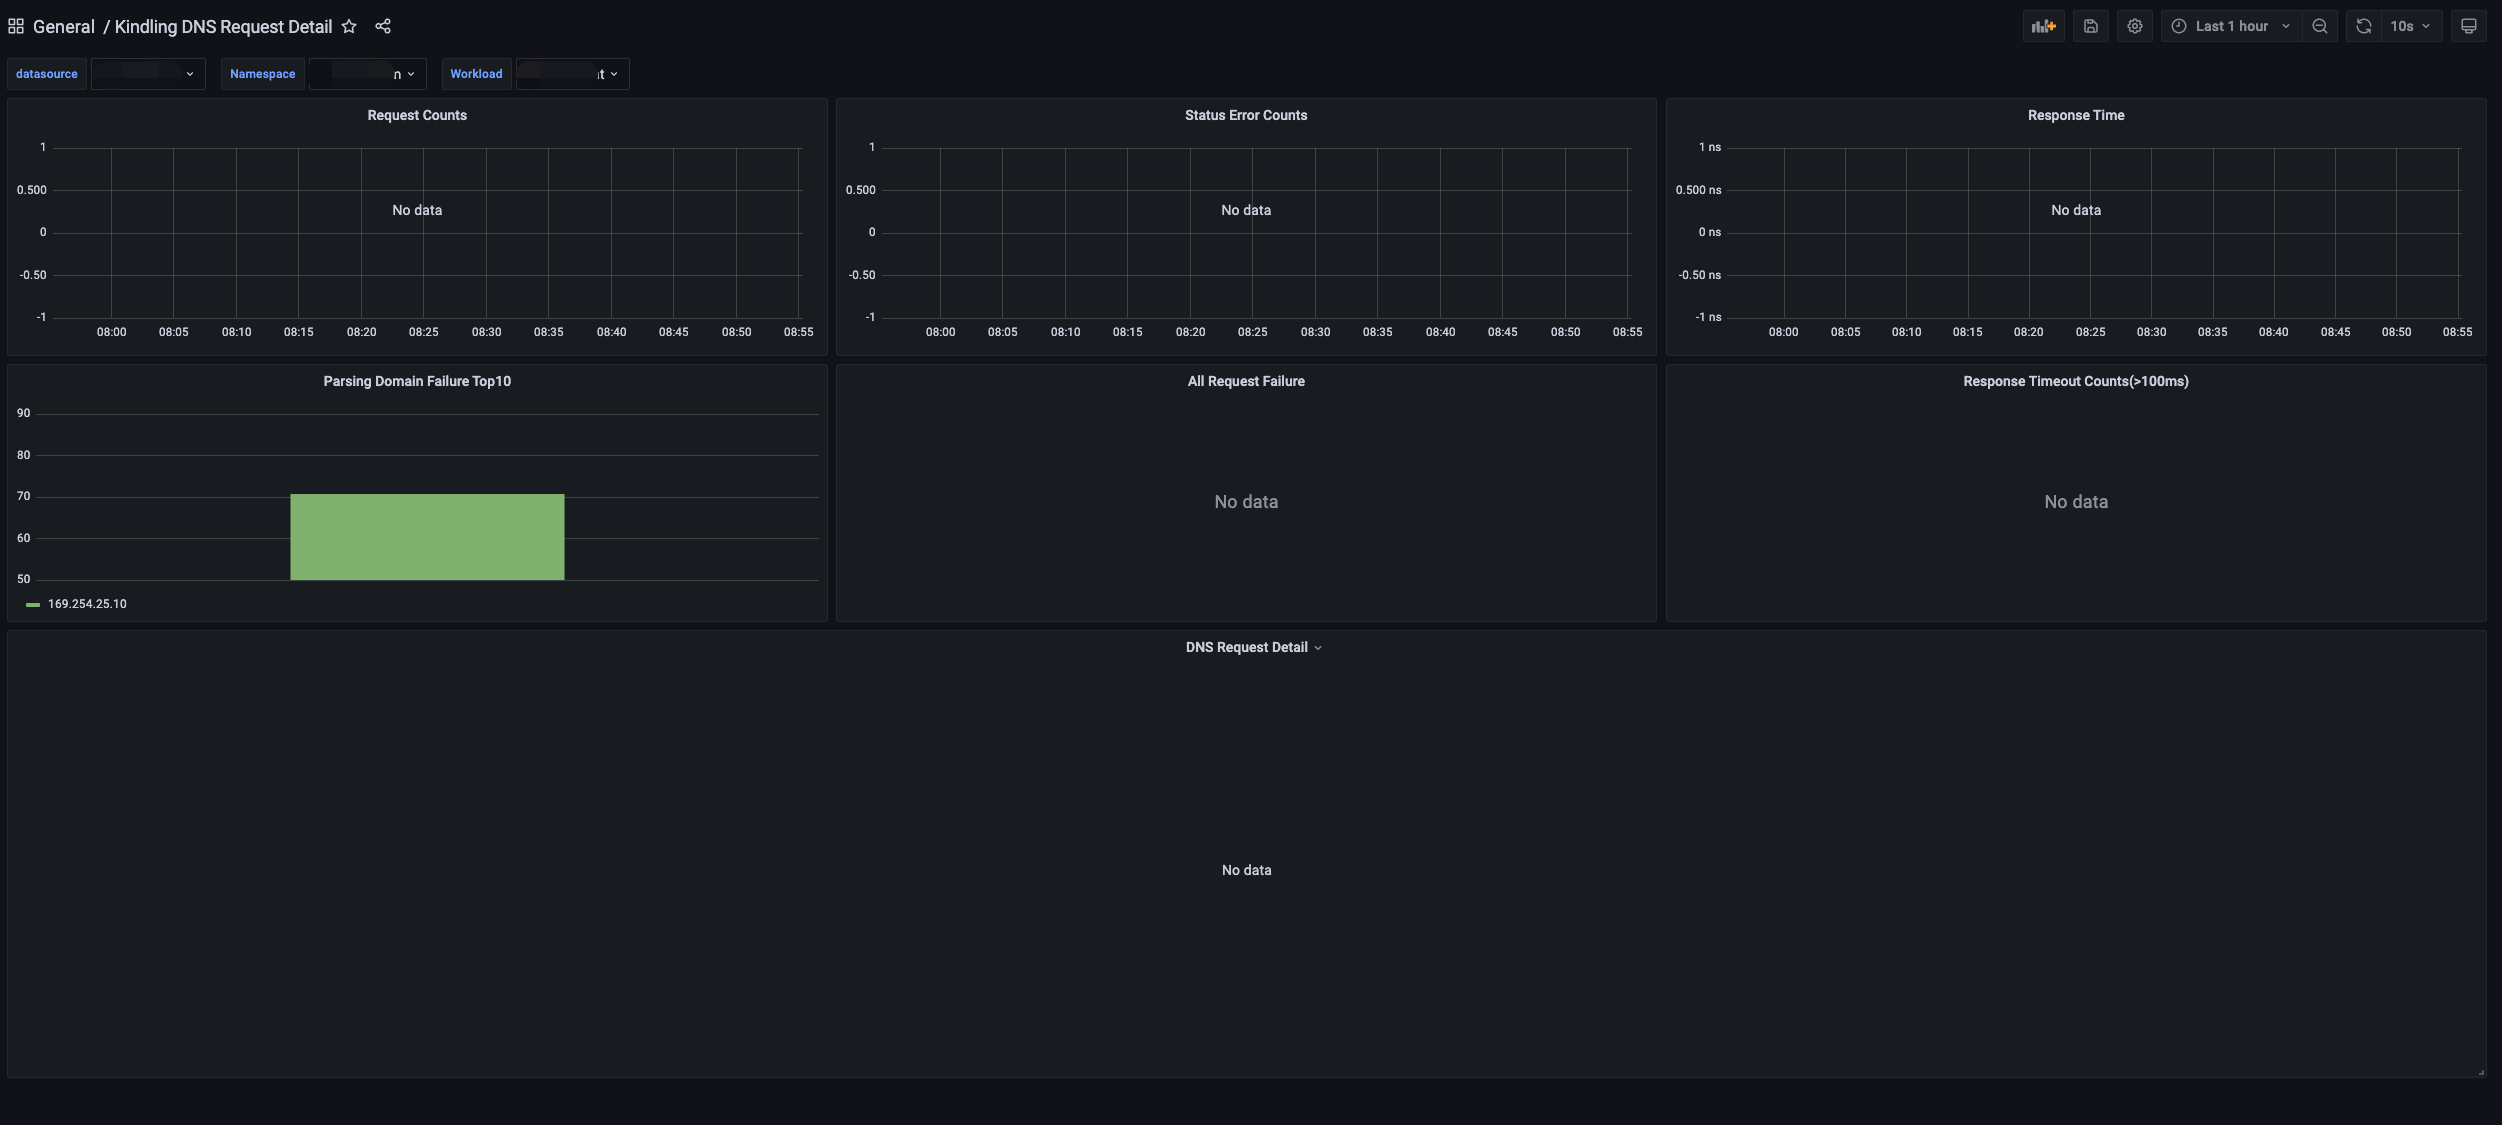
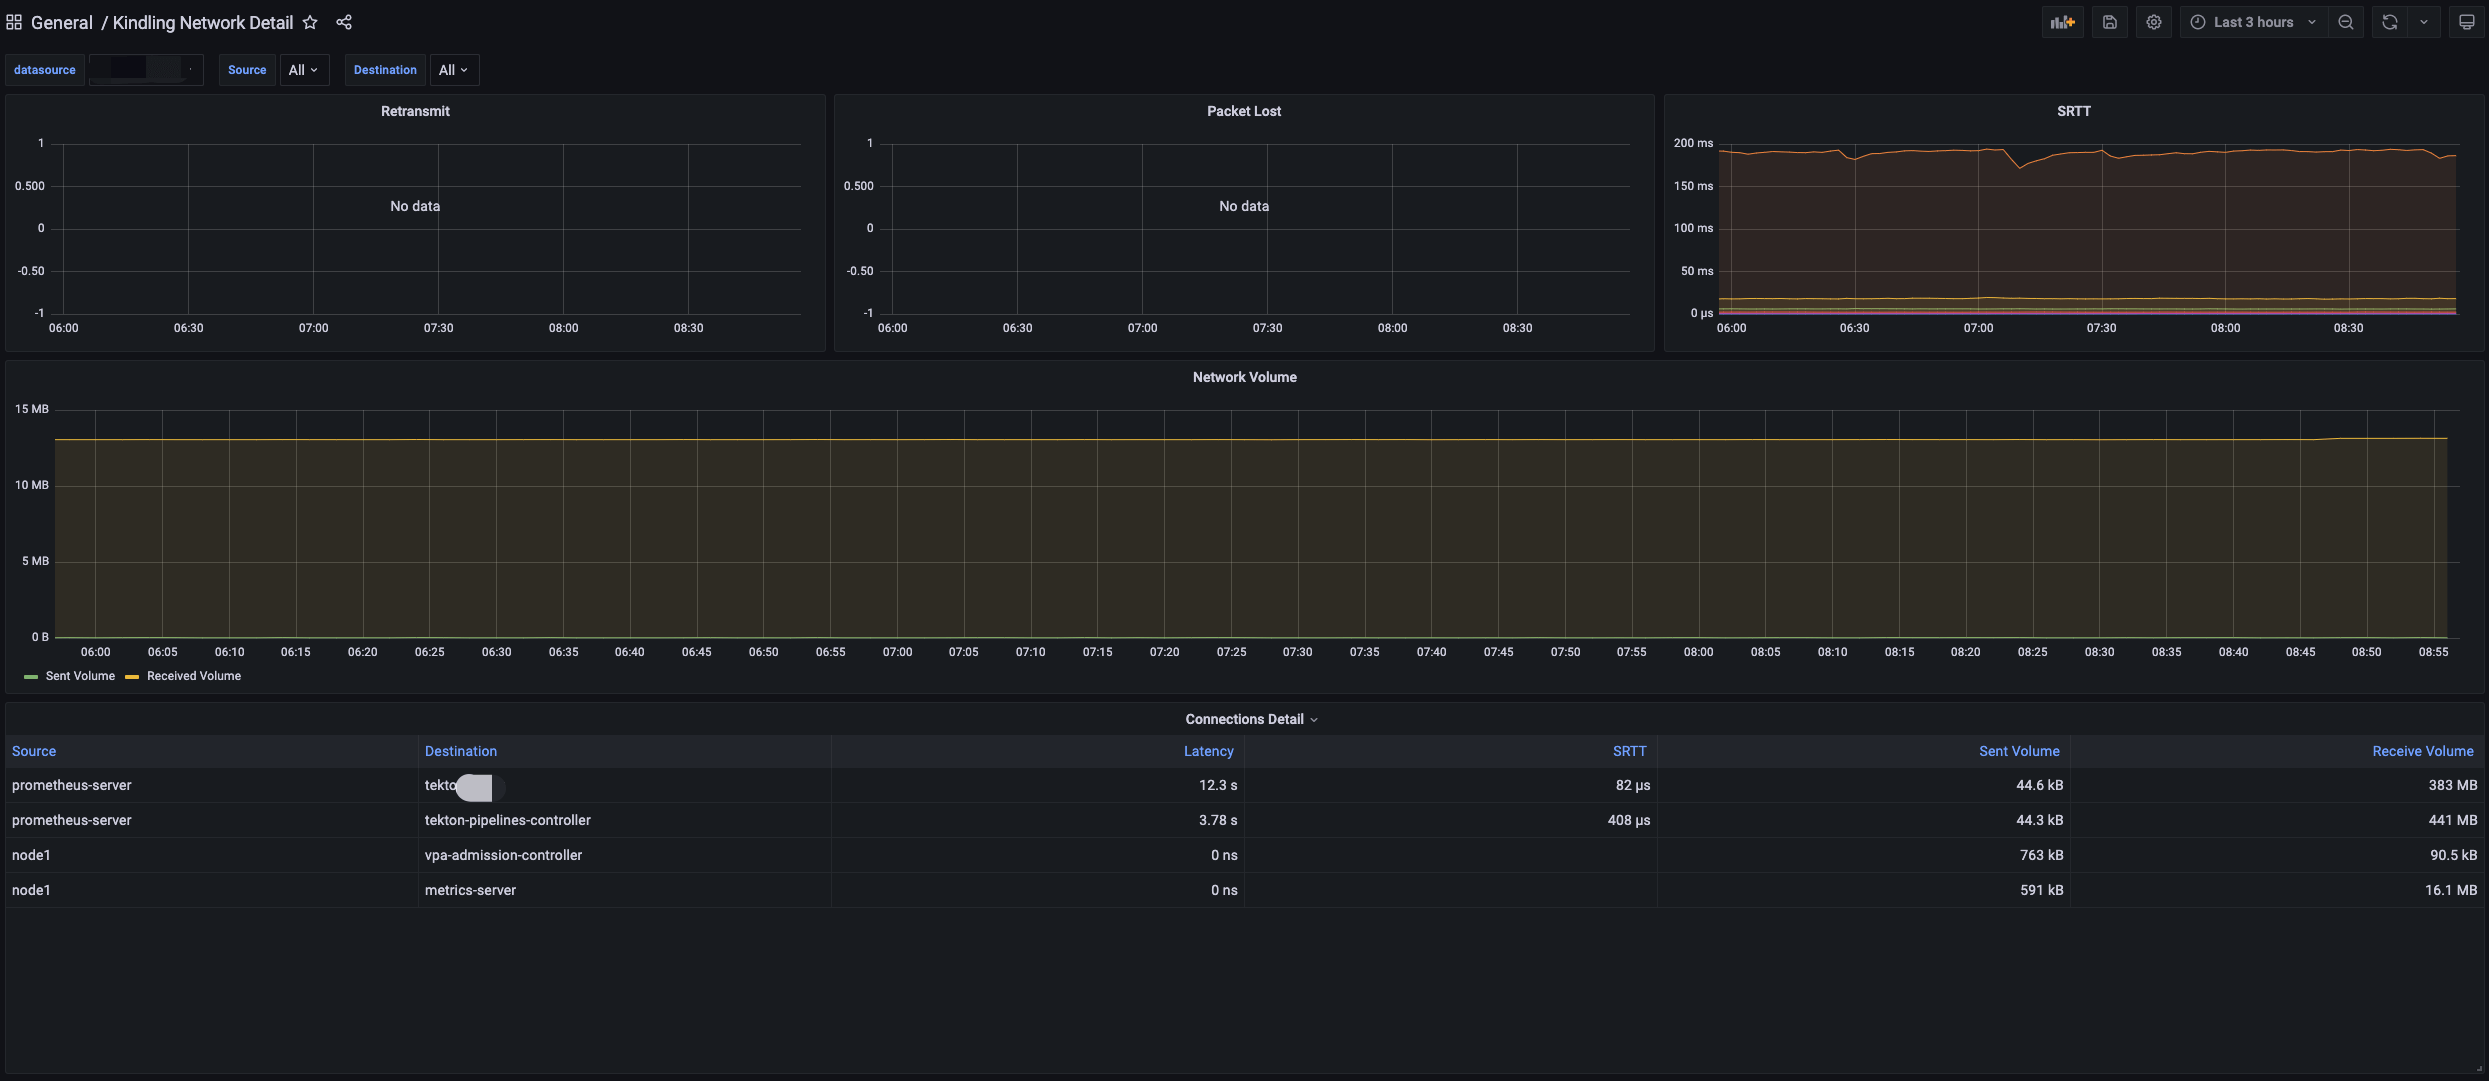
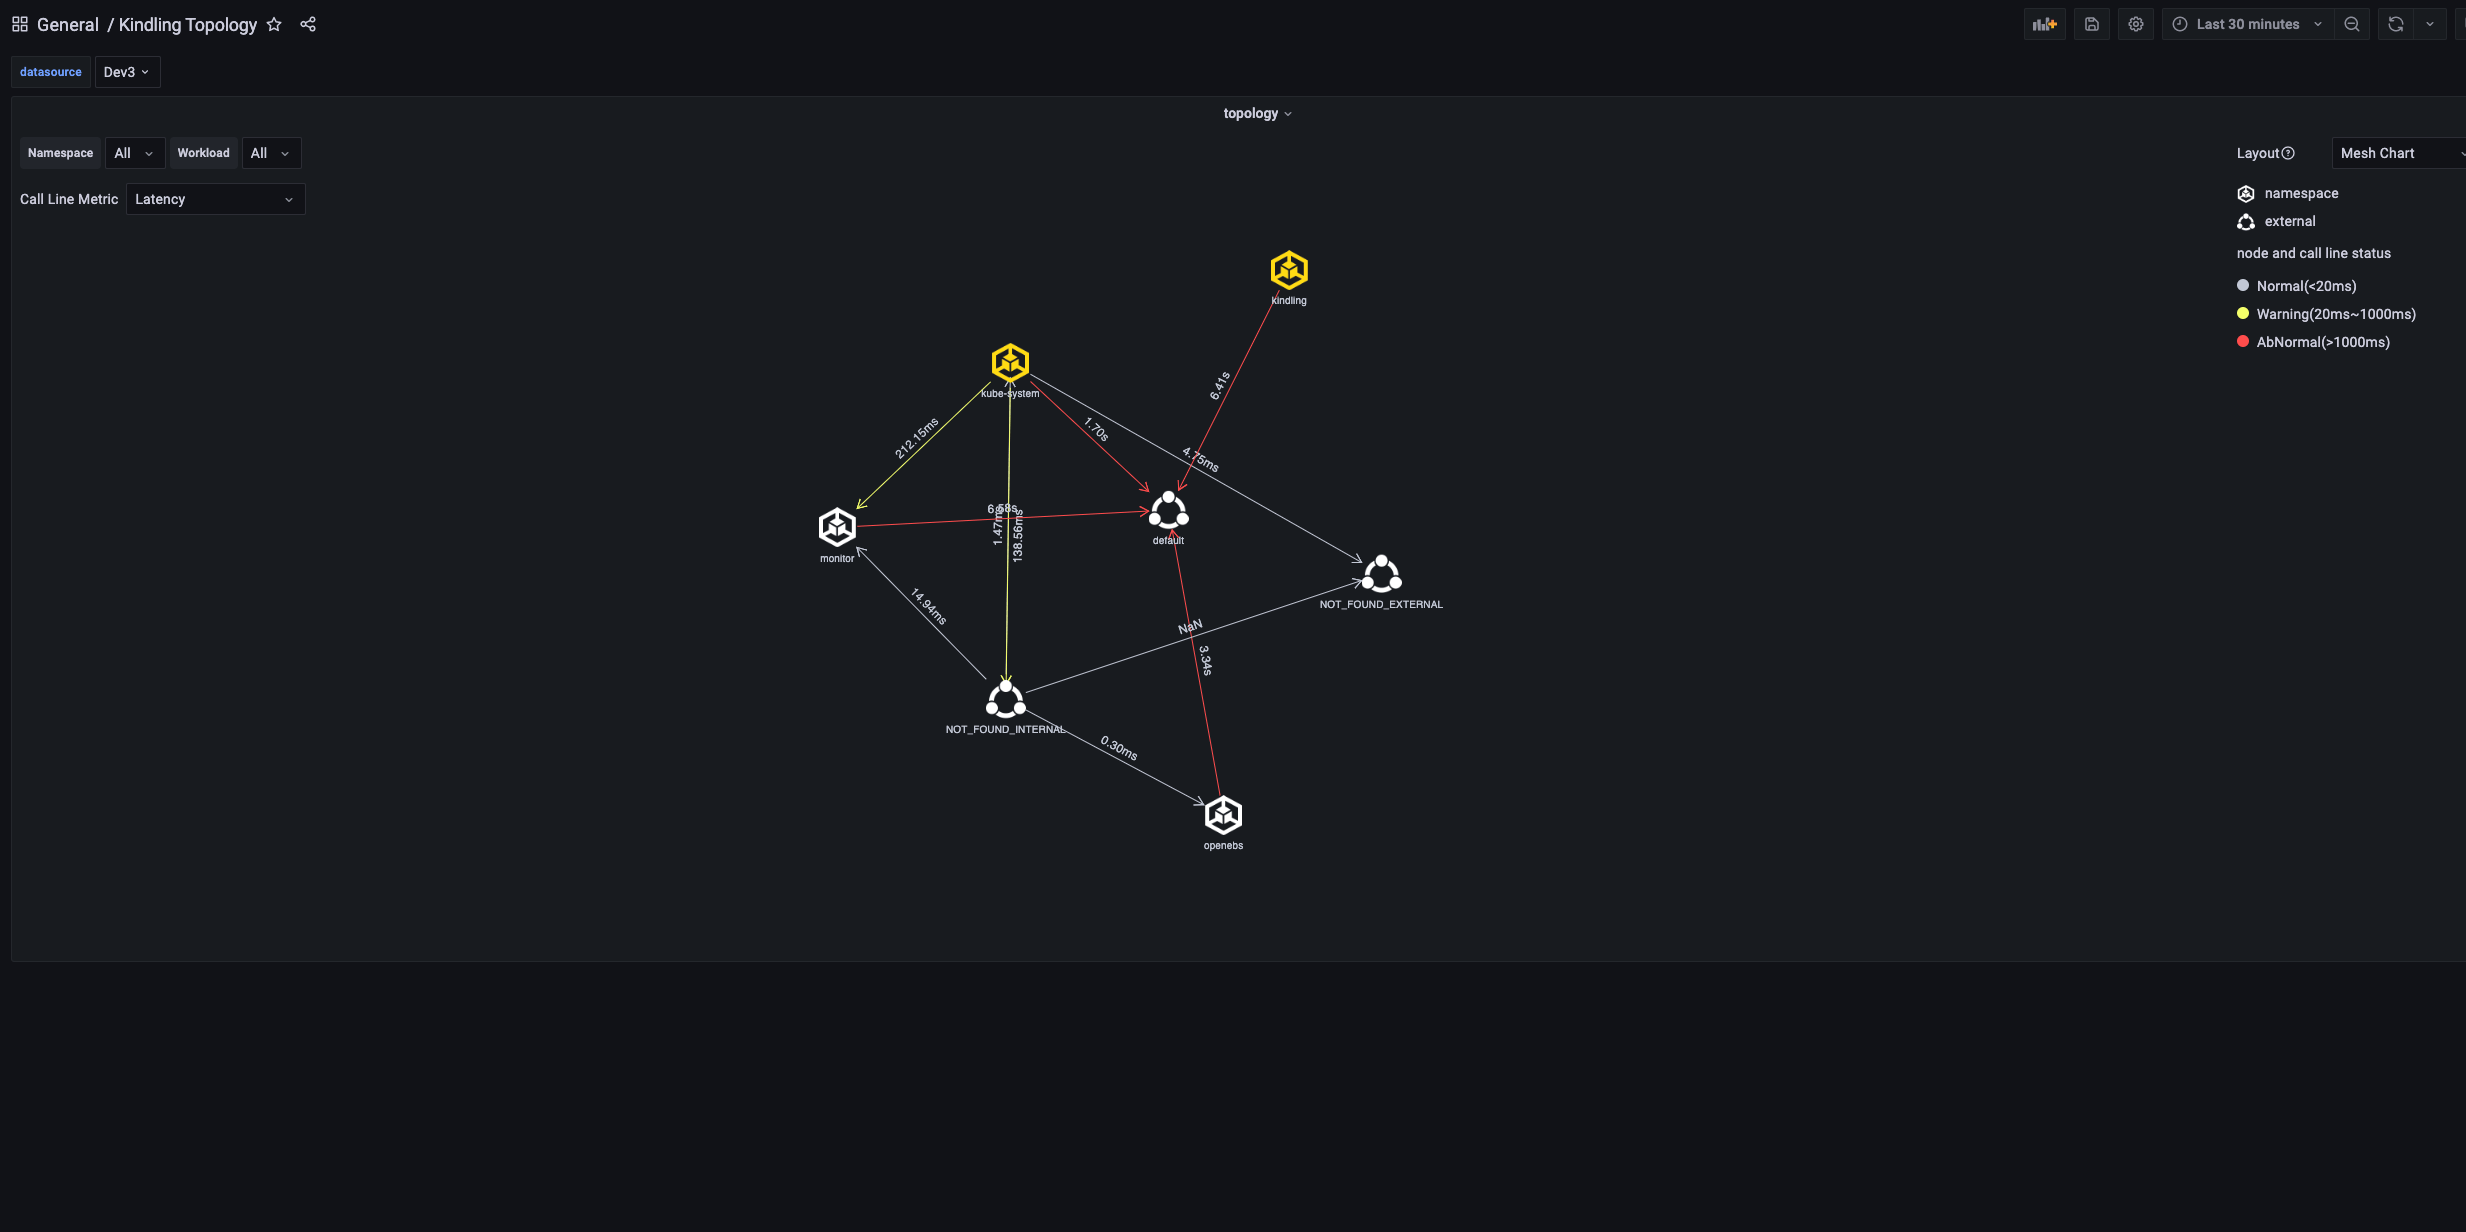
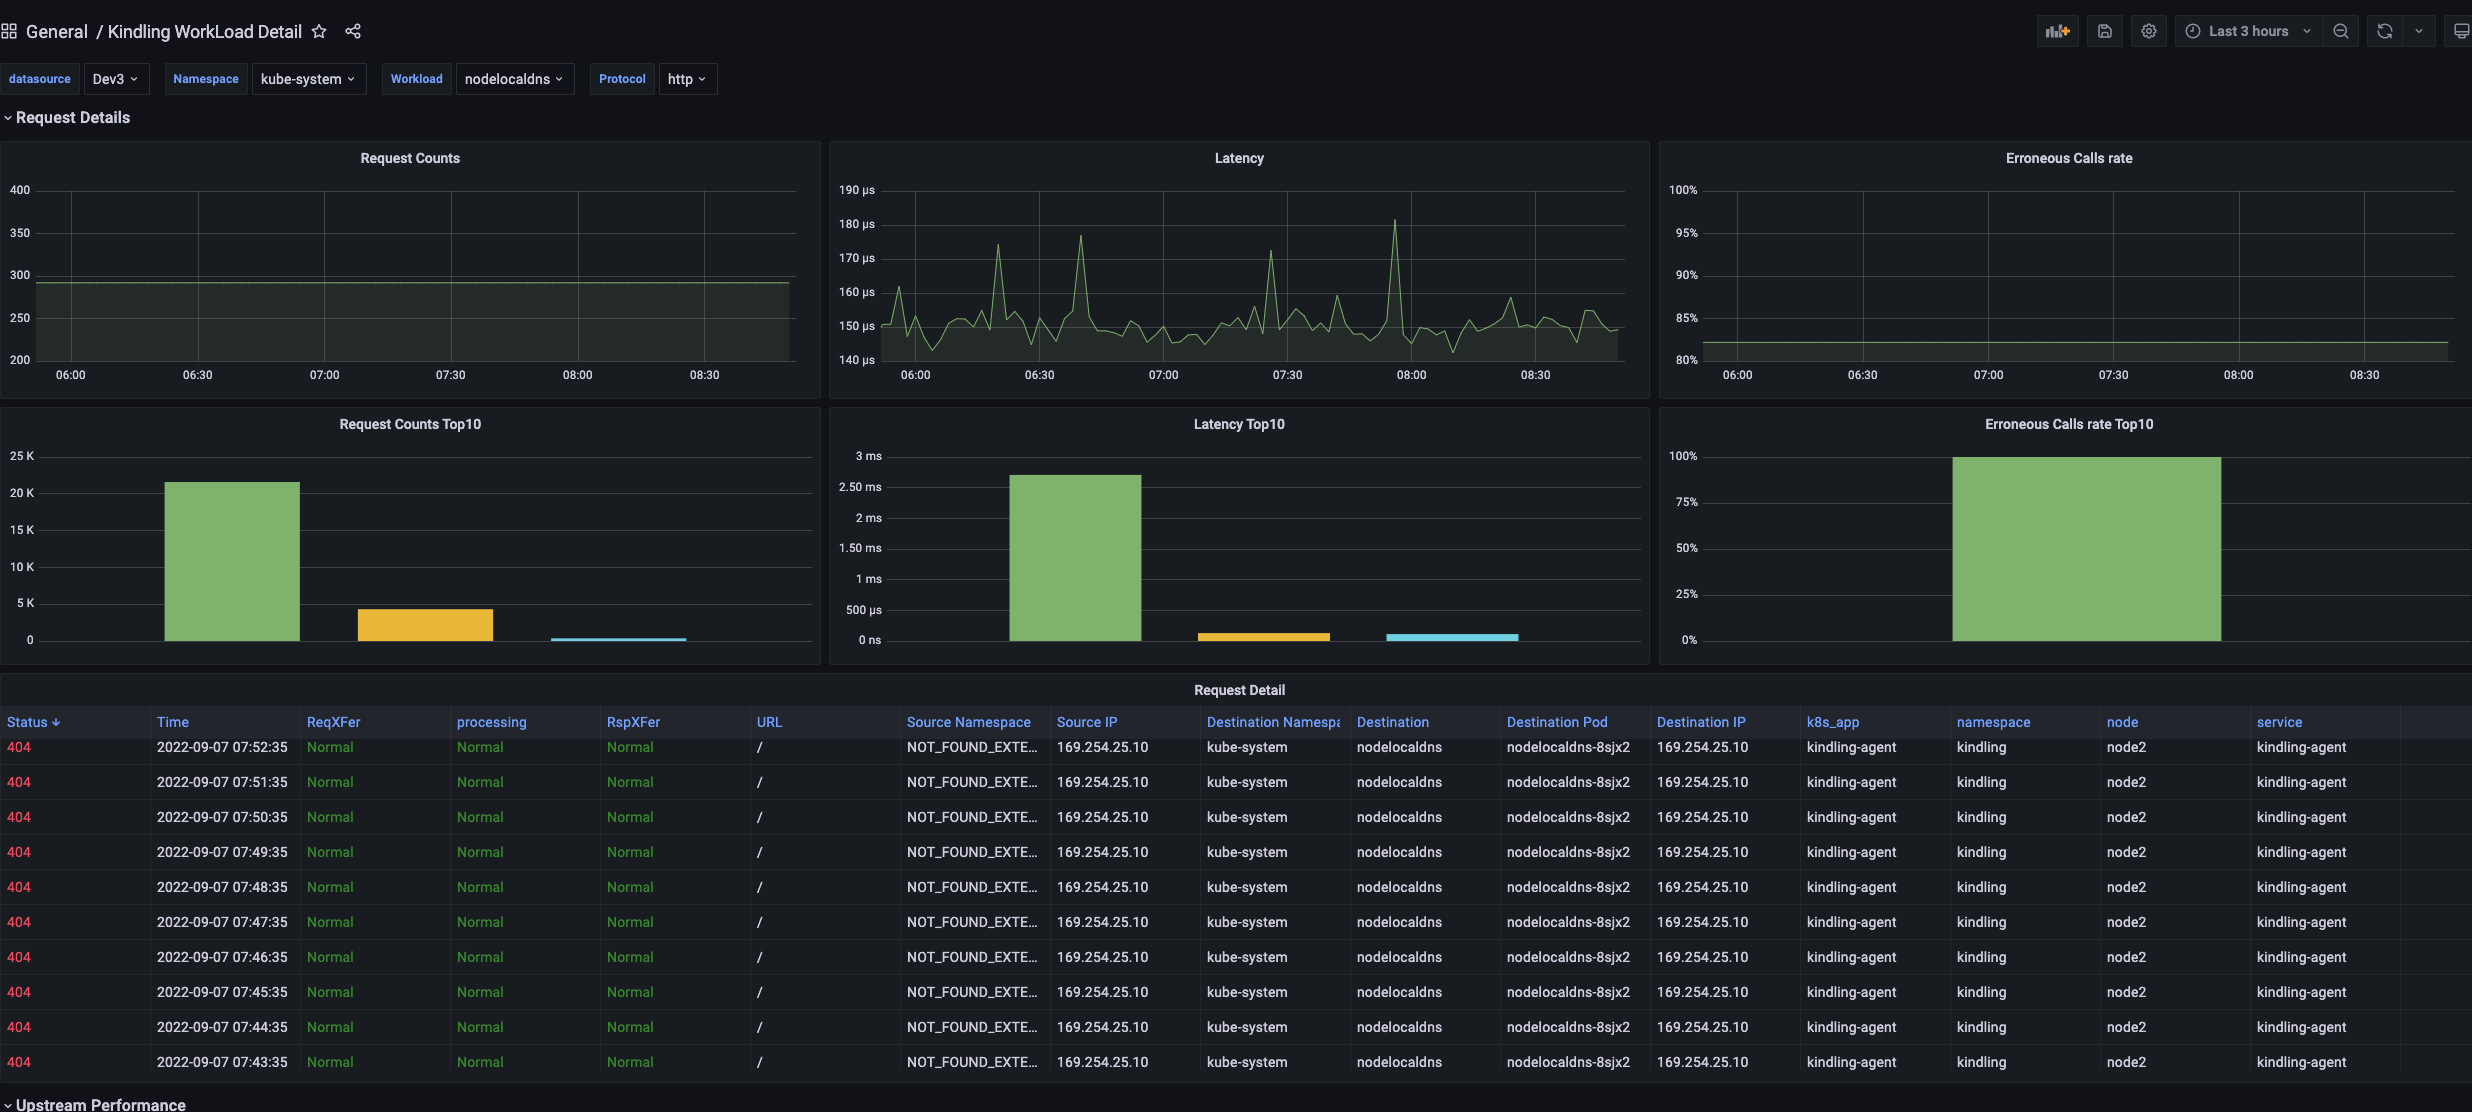
In the panel, you can see some information related to DNS, quaternions, and even the network topology between command spaces and Services. The resource consumption is also acceptable.
In some of the graphs above, you can find some data is vacant and some fields show NOT_FOUND_INTERNAL, which is not a good experience for the project.
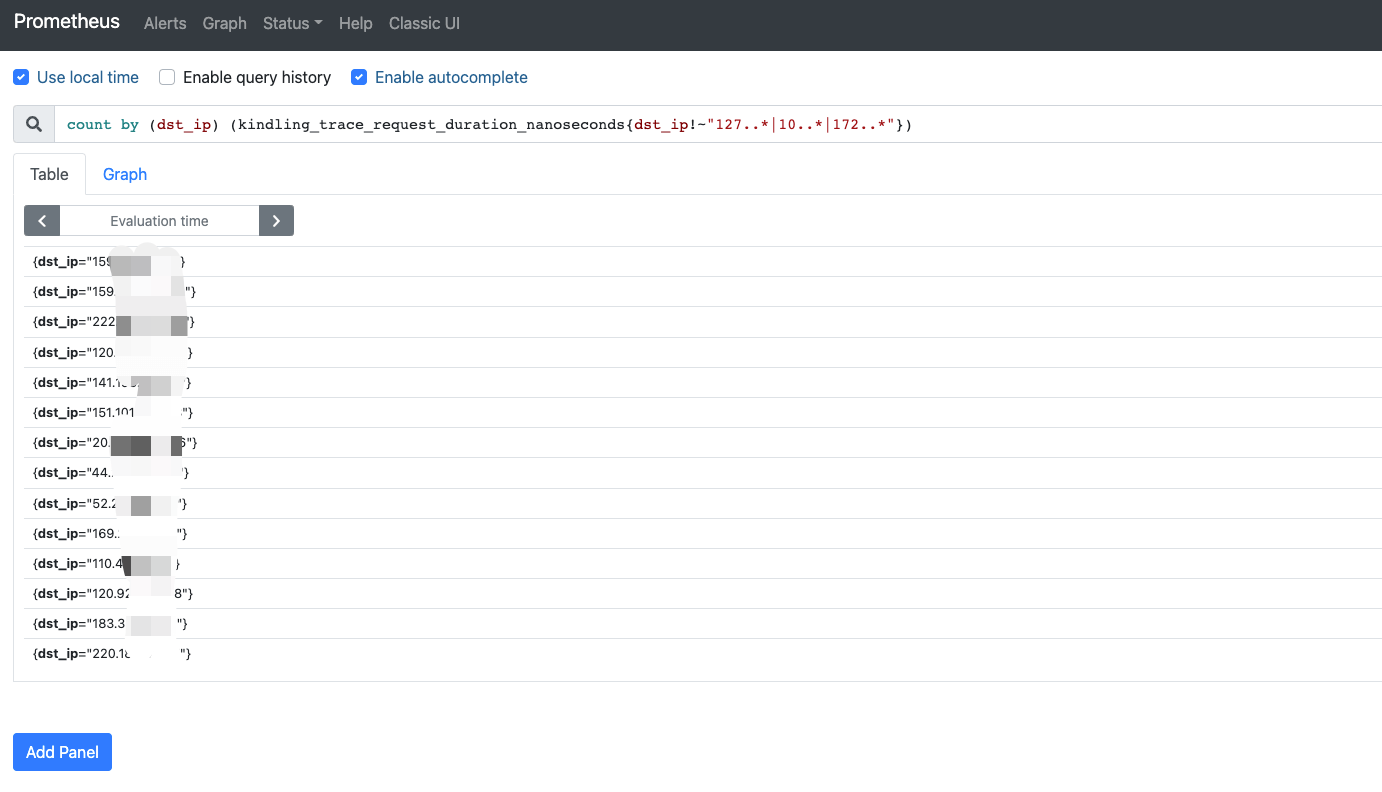
With the PromQL statement, I get the IP list of the cluster for external access.
|
|
5. Reference
http://www.kindling.space:33215/project-1/doc-35/https://github.com/CloudDectective-Harmonycloud/kindlinghttps://www.chenshaowen.com/blog/insight-kubernetes-network-by-kindling.html