So far, we have been using Linkerd in its most basic form without focusing on production-level related issues. In this section we will look at some of the key considerations for use in a production environment, including High Availability (HA) mode, Helm Chart, cross-cluster communication, and external Prometheus.
High Availability
High Availability describes a system with a redundant architecture that will continue to operate if some part of the system fails.Linkerd’s High Availability mode is designed to eliminate single points of failure in the control plane.
One way to enable HA mode is to specify the --ha flag for linkerd install, which enables several different behaviors. It is possible to deploy multiple copies of certain Linkerd control plane components.
- Controller
- Destination
- Identity
- Proxy Injector
- Service Profile Validator
Note that other components, such as Grafana, Prometheus, are not seen as critical components of the core and therefore will not be configured with multiple replicas (the data plane can still continue to function normally without these components). In addition to replicas, the HA model also configures resource requests for control plane components and enables Pod anti-affinity for these components, which ensures that only one instance of a particular component is dispatched to the same node.
However, it is important to note that there are some subtle differences in the HA pattern. First, the HA pattern changes the proxy injector to force the injection of proxies with proper annotations. This is to ensure that applications that use Linkerd for mTLS in a production environment can rely on the proxy, but if Linkerd’s proxy injector is somehow unavailable, then Pods cannot be created. For example, the kube-system namespace is problematic, so using HA mode requires adding the tag config.linkerd.io/admission-webhooks: disabled to the kube-system namespace to allow the creation of Kubernetes components, even if Linkerd has some sort of problem, but don’t worry too much, the linkerd check command will also print an alert message when the tag is not on the kube-system namespace when running in HA mode.
Helm Chart
It is generally not recommended to use the Linkerd CLI tool for installation in a production environment, but rather a tool such as Helm.
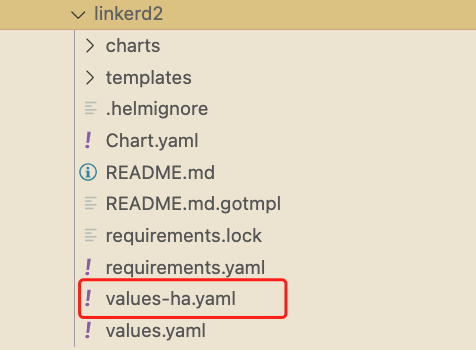
Linkerd provides a Helm Chart for both normal and HA modes, which includes a template called values-ha.yaml that can be used as the basis for deploying high availability to clusters, and Helm is particularly useful for automating the configuration of Linkerd on newly created clusters.
One thing to note is that the Helm installation process does not generate a certificate for you as the linkerd install command does, so you need to use your own certificate during the installation process, as described in the mTLS chapter earlier.
Whether you install with Helm or not, in HA mode or not, for production systems you should generate your own root and issuer certificates. Creating your own trust anchor will allow you to avoid the hassle of manual rotation (we recommend setting the expiration time to 10 years instead of the default 1 year) and also generate issuer certificates for future clusters, make sure to store the private key in a safe place!
Prometheus metrics
The Linkerd control plane contains an instance of Prometheus, and the data in this instance is used to provide support for the Linkerd dashboard and the output of commands such as linkerd viz stat.
By default, this instance only retains the last 6 hours of metrics data, and production environments often need to access metrics for longer periods of time, such as 1 week, 1 month, or even 1 year. Of course we can reconfigure the Prometheus instance to increase the data retention time, but obviously this is not a recommended approach and the best practice is to export the metrics from the Prometheus provided by Linkerd’s control plane to a dedicated remote store such as Cortex, Thanos or Victoriametrics, with Victoriametrics being more recommended based on our learning of Prometheus earlier.
If you already have a Prometheus cluster available, we can also configure Linkerd to use external Prometheus instances and get metrics for Linkerd control plane components and agents.
Configure external Prometheus
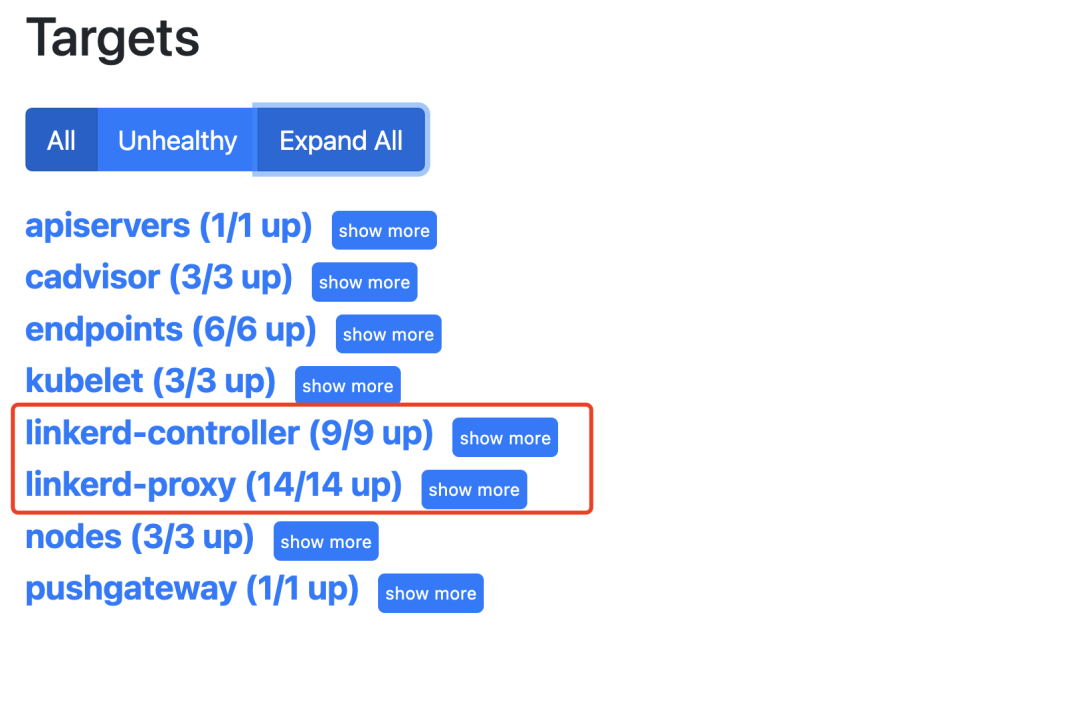
If you want to use an external Prometheus you need to add the following crawl configuration to the external Prometheus.
|
|
The above crawl configuration can be obtained by using the command kubectl get cm -n linkerd-viz prometheus-config -o yaml to get the complete configuration and ensure that Prometheus can crawl the relevant metric data after the crawl configuration is updated.
Linkerd’s viz extensions rely on Prometheus instances to provide data for the dashboard and CLI. The installation has a prometheusUrl field that can be used to configure the address of an external Prometheus, and all of these components can be configured to an external Prometheus URL using this parameter, but it should be noted that when using an external Prometheus and configuring the prometheusUrl field, the Linkerd’s Prometheus will still be included in the installation. If you want to disable it, be sure to also include the following configuration.
For example, if we have an instance of Prometheus available in the kube-mon namespace, we can replace it with the command shown below.
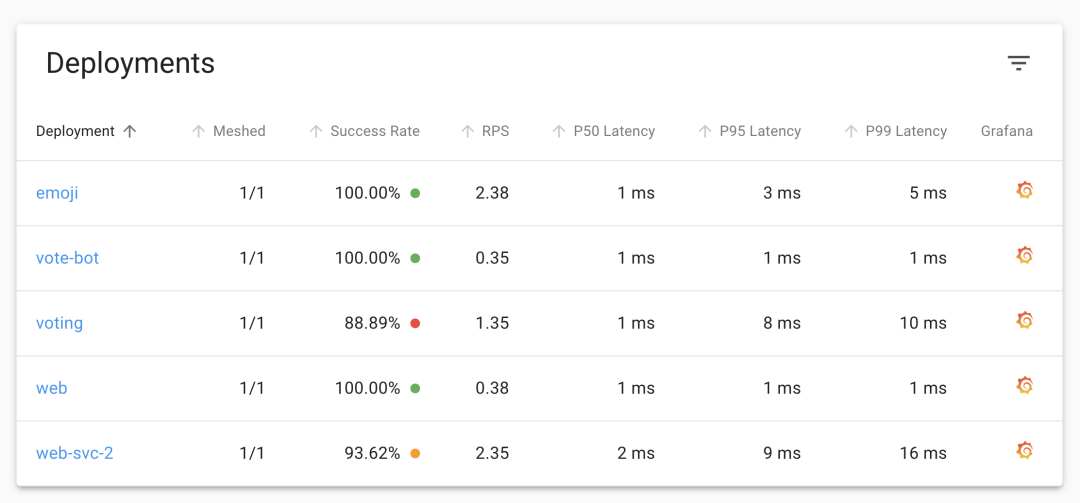
If you are using Helm for the installation, you can configure it directly from the values file. After the update, you can still see the application’s metrics data when you revisit the Linkerd Dashboard.
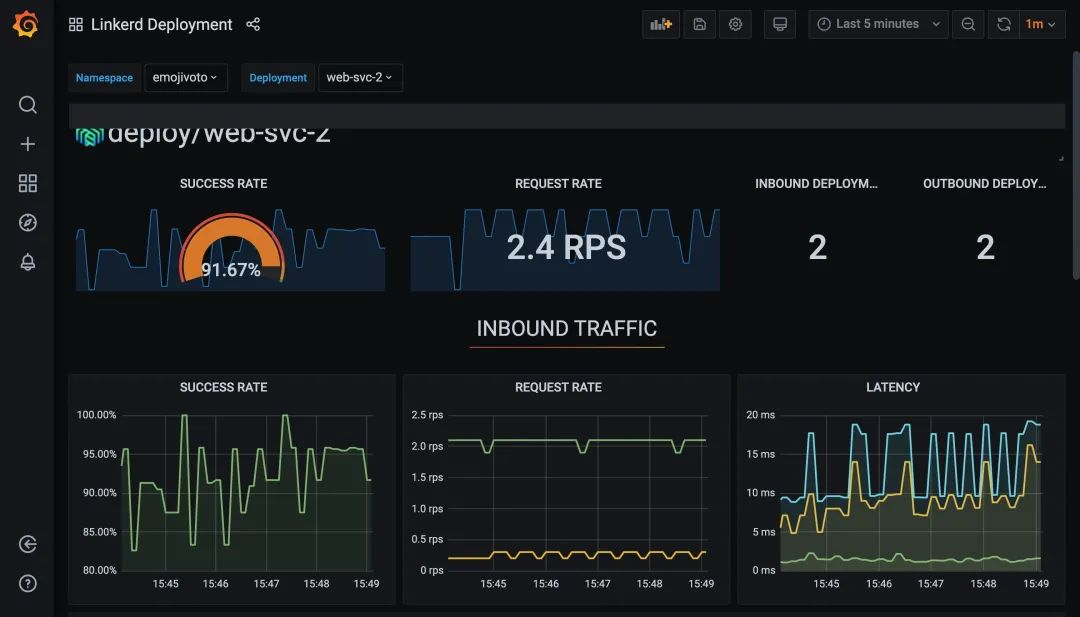
The charts, including Grafana’s, are also displayed normally.
This makes it possible to rely on our external Prometheus itself for how long Prometheus metrics are stored or how they are stored. This of course reduces the complexity of Linkerd itself.
Multi-Cluster Communication
Linkerd supports multicluster communication, a feature that allows services to communicate transparently across Kubernetes clusters. When enabled, if Service A communicates with Service B, it does not need to know if B is running on the same cluster or a different cluster, in the same datacenter or on the Internet. The same mTLS, metrics, and reliability features are applied uniformly for both intra-cluster and cross-cluster communications. In fact, when combined with traffic segmentation, Service B can migrate or failover from a local cluster to a remote cluster, or across separate remote clusters.
The Linkerd multi-cluster component is installed separately from the control plane component using the linkerd multi-cluster install command, which creates a namespace named linkerd-multi-cluster containing two components: service-mirror and linkerd -gateway, which are used to ensure the health of the connection between the two clusters and to route traffic for services that exist on the remote or target cluster.
Each participating cluster must be running the Linkerd control plane with these components installed. This eliminates a single point of failure for any one cluster: if one cluster is removed, crashes, or becomes unavailable, the remaining clusters and the control plane will continue to operate.
The most difficult part of a multi-cluster setup is the mTLS infrastructure: the issuer certificates on each cluster must be signed by the same root of trust. This means that simply running linkerd install for installation can be problematic and requires specifying the same root certificate.
Other
In addition to the above important things to consider before deploying Linkerd to a production environment, there are a few other things to keep in mind.
- Configuring Resources: When you deploy Linkerd in HA mode, Linkerd sets CPU and memory resource requests and limits for control plane components. These limits are a relatively reasonable value, but not all applications are the same, and you may need to adjust these resource configurations to fit your needs. For high traffic services (>1000 requests per second per instance), we may also need to adjust the proxy resources, or you can specify the
config.linkerd.io/proxy-cpu-limitannotation when deploying the application to configure the proxy concurrency. - Check for clock deviations: It is important to ensure that nodes in a cluster stay in sync, e.g. by using NTP, and large clock deviations between nodes can break the Linkerd agent’s ability to verify the certificates they use for mTLS (large clock deviations can make reading log files across nodes difficult when troubleshooting problems in a cluster!) .
- HANDLING NET_ADMIN: Linkerd’s
proxy-initcontainer runs when the Pod is injected and is responsible for configuringiptablesrules so that all TCP traffic to and from the application container is automatically routed through the proxy container. This requires the Linux CapabilityNET_ADMINfor Kubernetes, which means that any system adding Linkerd-enabled workloads to the cluster must be granted this capability. If this is not desired for security reasons, an alternative is to use theLinkerd CNIplugin to perform this operation outside of the workload creator permissions. - linkerd viz tap permissions: We’ve learned about the powerful command tap earlier, but this feature comes with a lot of risk as the command can expose potentially sensitive information to users, however Linkerd allows us to use Kubernetes RBAC restrictions to control who can access that output.
- Use Ingress: Unlike some other service mesh, Linkerd does not provide its own Ingress controller. Instead, you can use Linkerd with other available Kubernetes Ingress controllers, and when doing so, we recommend injecting the Ingress controller with the Linkerd proxy, which will allow Linkerd’s mTLS and observability to be available from the moment the request enters the cluster.
At this point we basically understand how to use Linkerd in a production environment. It is highly recommended to fully understand these concepts and read through the Linkerd documentation before deploying Linkerd to a production environment.