I have recently been learning about BPF, which is one of the more popular dynamic tracing techniques available today. Simply put, it allows us to insert a piece of code that executes along with the program without interrupting the program that is currently running. For example, if you want to know the value of each return of a function, you can write a BPF program that prints out the value of each return; then hook the function to the function call, so that the program will execute our BPF program every time the function is called.
This technique of observing the runtime of a program without terminating it is very useful.
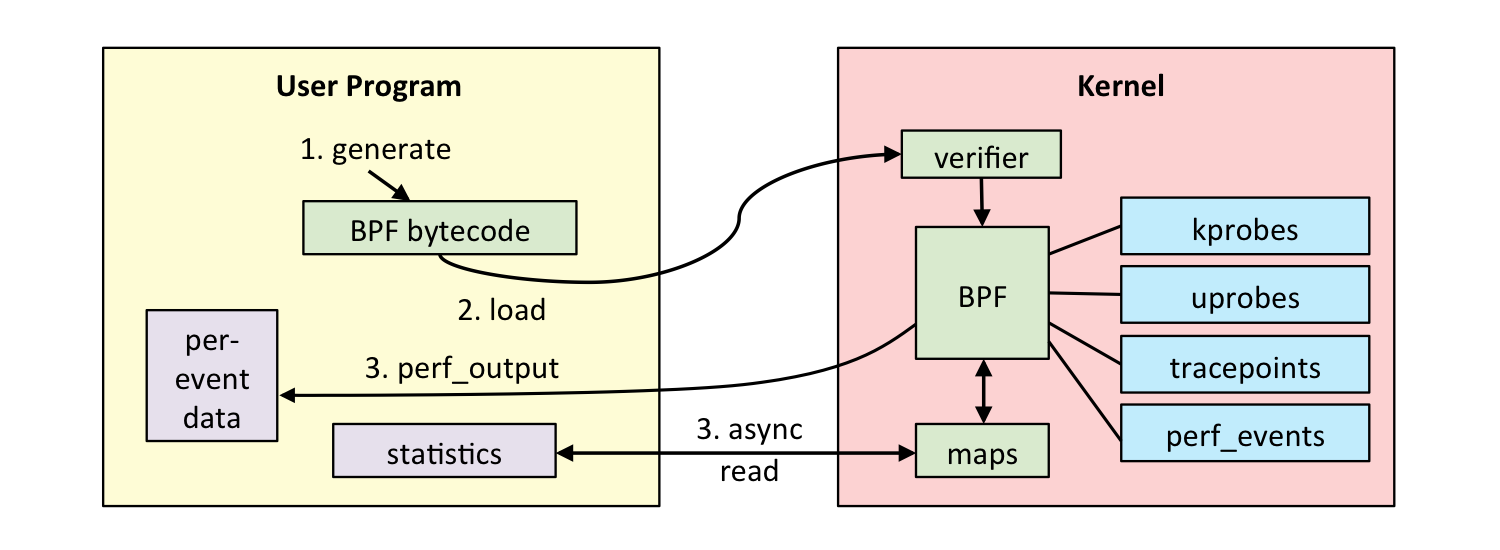
It works roughly as follows.
- find the address of the function call to be observed (so with BPF we usually need binary with debug symbol), replace the instruction at this address with
int3, i.e. a break, to save the instruction that should have been executed. - when the program is executed here, instead of calling the function directly, it finds an uprobe handler here and executes the handler we defined.
- the original program continues to execute.
- when we stop the probe, we restore the original saved instructions.
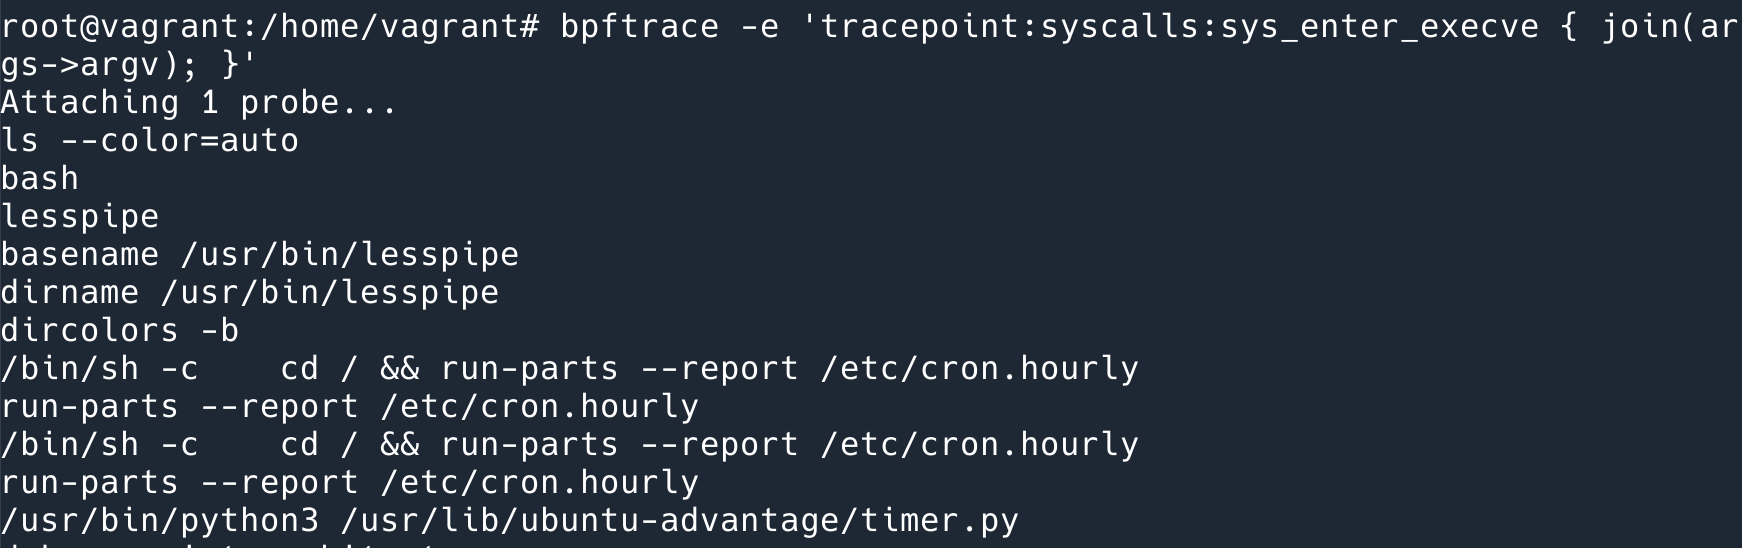
Example: This line prints out all the commands executed in the system bpftrace -e 'tracepoint:syscalls:sys_enter_execve { join(args->argv); }' . The principle is that each time execve is executed, it will execute the join (print) that we defined.
bpftrace is a command-line program with a syntax similar to awk that does the following: compiles the program we wrote (in this case, the program refers to the syntax defined by bpftrace, not the BPF program) into a BPF program and attaches it to the appropriate event.
The above description shows that the necessary conditions needed to use this method to trace the program are
- the Kernel should support BPF; (4.19+);
- binary is available for tracing.
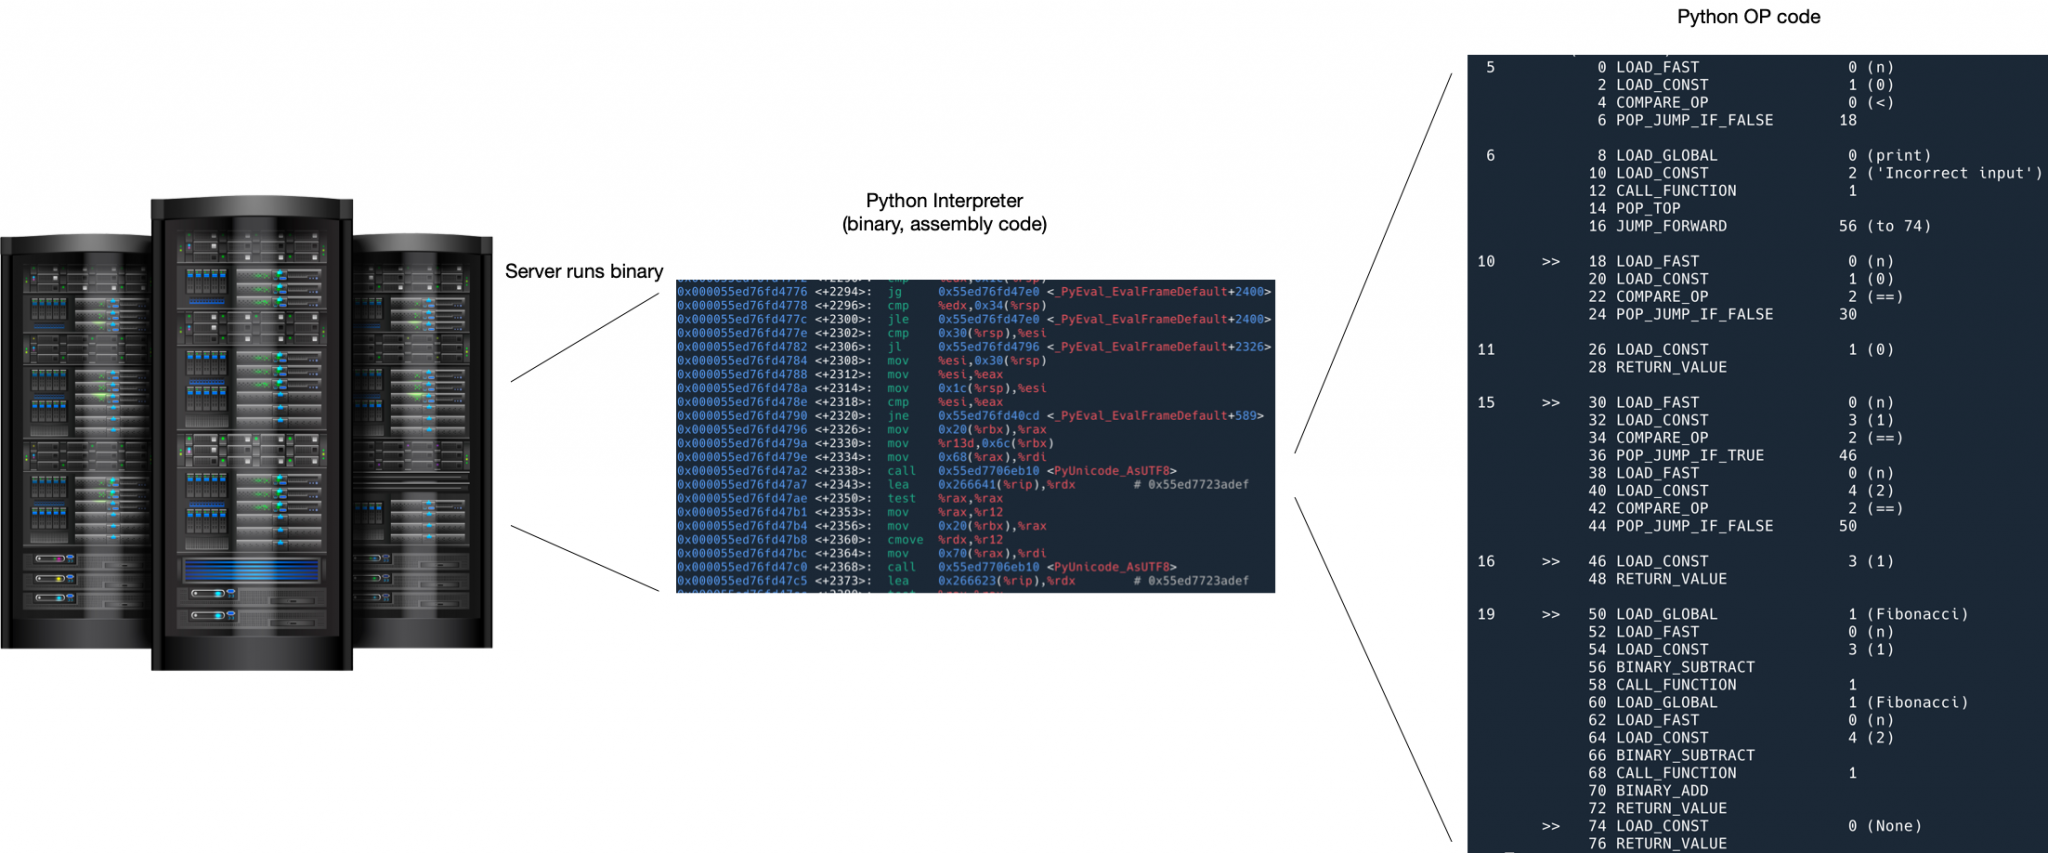
In an interpreted language like Python, binary is actually an interpreter, and inside the interpreter is the running Python code. If we follow the above method, we are actually tracing the code of the interpreter and not the code of our Python application.
Tracing Python programs using USDT
One solution is to use USDT tracing.
USDT is User-level statically defined tracing, and the Python interpreter defines a number of traces (which can be called probes, or markers) for us in advance, which are not activated by default, so they have no impact on performance. When you want to trace, you can activate a few of them and print out the arguments they provide.
There are several prerequisites to be able to use USDT:
- the Kernel should support BPF; (4.19+); (in fact, you can use Dtrace or systemtap)
- Python should be compiled with trace support turned on (compile with -with-dtrace option), on my servers, Python 3.10 on Ubuntu is turned on, Python 3.10 on Fedora does not seem to be turned on.
Tracing Python programs with USDT
First you need to install bpftrace. Installation instructions can be found here.
USDT markers in binary can be listed with this command: bpftrace -l 'usdt:/usr/bin/python3:*'
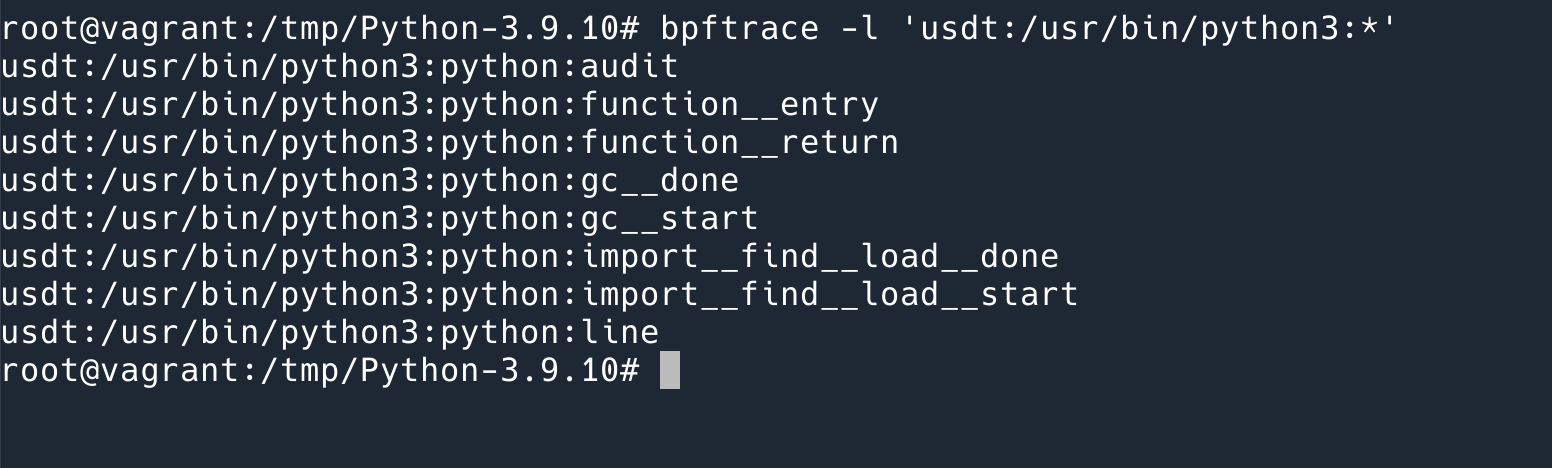
As you can see, there are not many markers supported, only 8 in total.
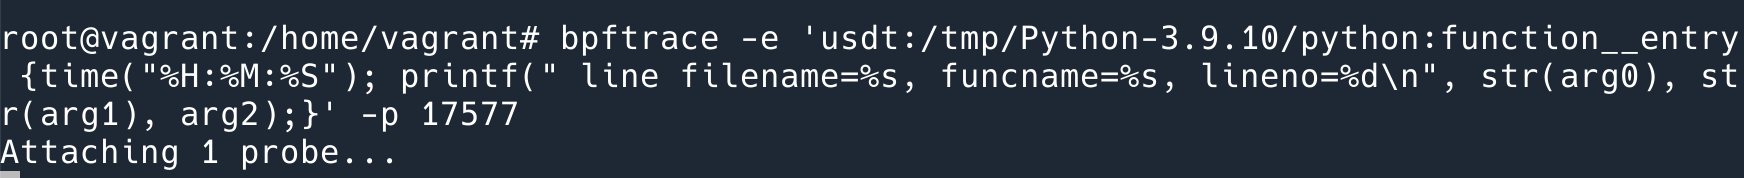
Let’s try one of them out: this command prints out the time of each Python function call, the address of the source code, the function name, and the line number.
|
|
where -p 15552 is the pid of the running Python program, -e is followed by the code of bpftrace, much like awk, the first is probe, {} inside is the code, mainly two lines, the first line prints out the time, the second line prints out function__entry the probe provides three parameters. (It should be noted that the string argument needs to be printed out using bpftrace’s built-in str() function, otherwise it prints out the char * address; also note that although the Python documentation says the three arguments are $arg1 $arg2 $arg3, the actual printout should use arg0 , arg1 , arg2 …)
The effect is as follows.
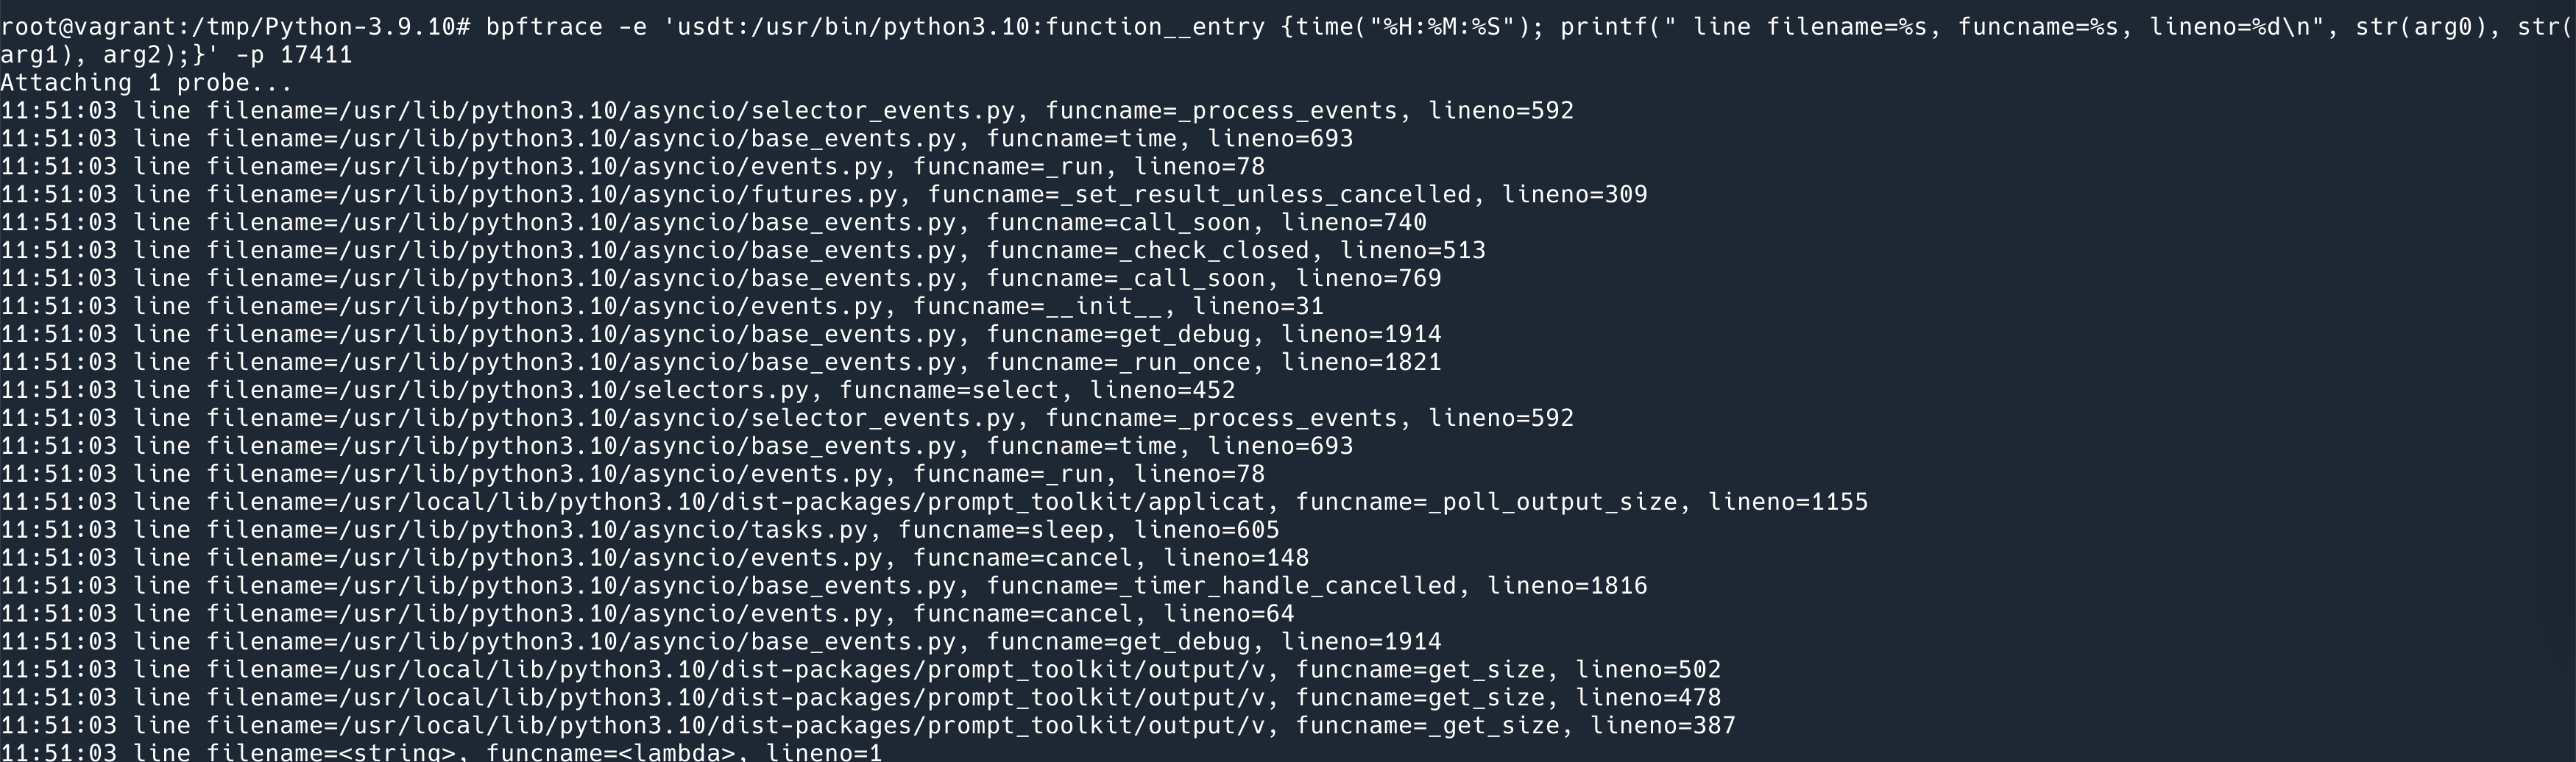
Several other markers serve the following purposes.
- function__entry: The entry point of the function
- function__return: when the function exits
- line: triggered for every line of Python code executed
- gc__start and gc__done: triggered at the start and end of gc
- import__find__load__start and import__find__load__done: triggered at the beginning and end of import
- audit: triggered when
sys.auditis called
As you can see, not many are currently supported, and as you can see from these markers, most of them are there to let you know what the Python interpreter is doing, not to debug, which can be used to solve performance problems if you encounter them, but not much help if you encounter logical errors. For example, you can’t see the value of a variable at a given moment via usdt.
How USDT works
USDT works similarly to the uprobe mentioned above, in that when it is activated it changes the original instruction and inserts int3 to execute our handler.
Seeing is believing.
We can use some tools to see how it works.
Taking function__entry as an example, we first find its marker in Binary, inside .note.stapsdt.
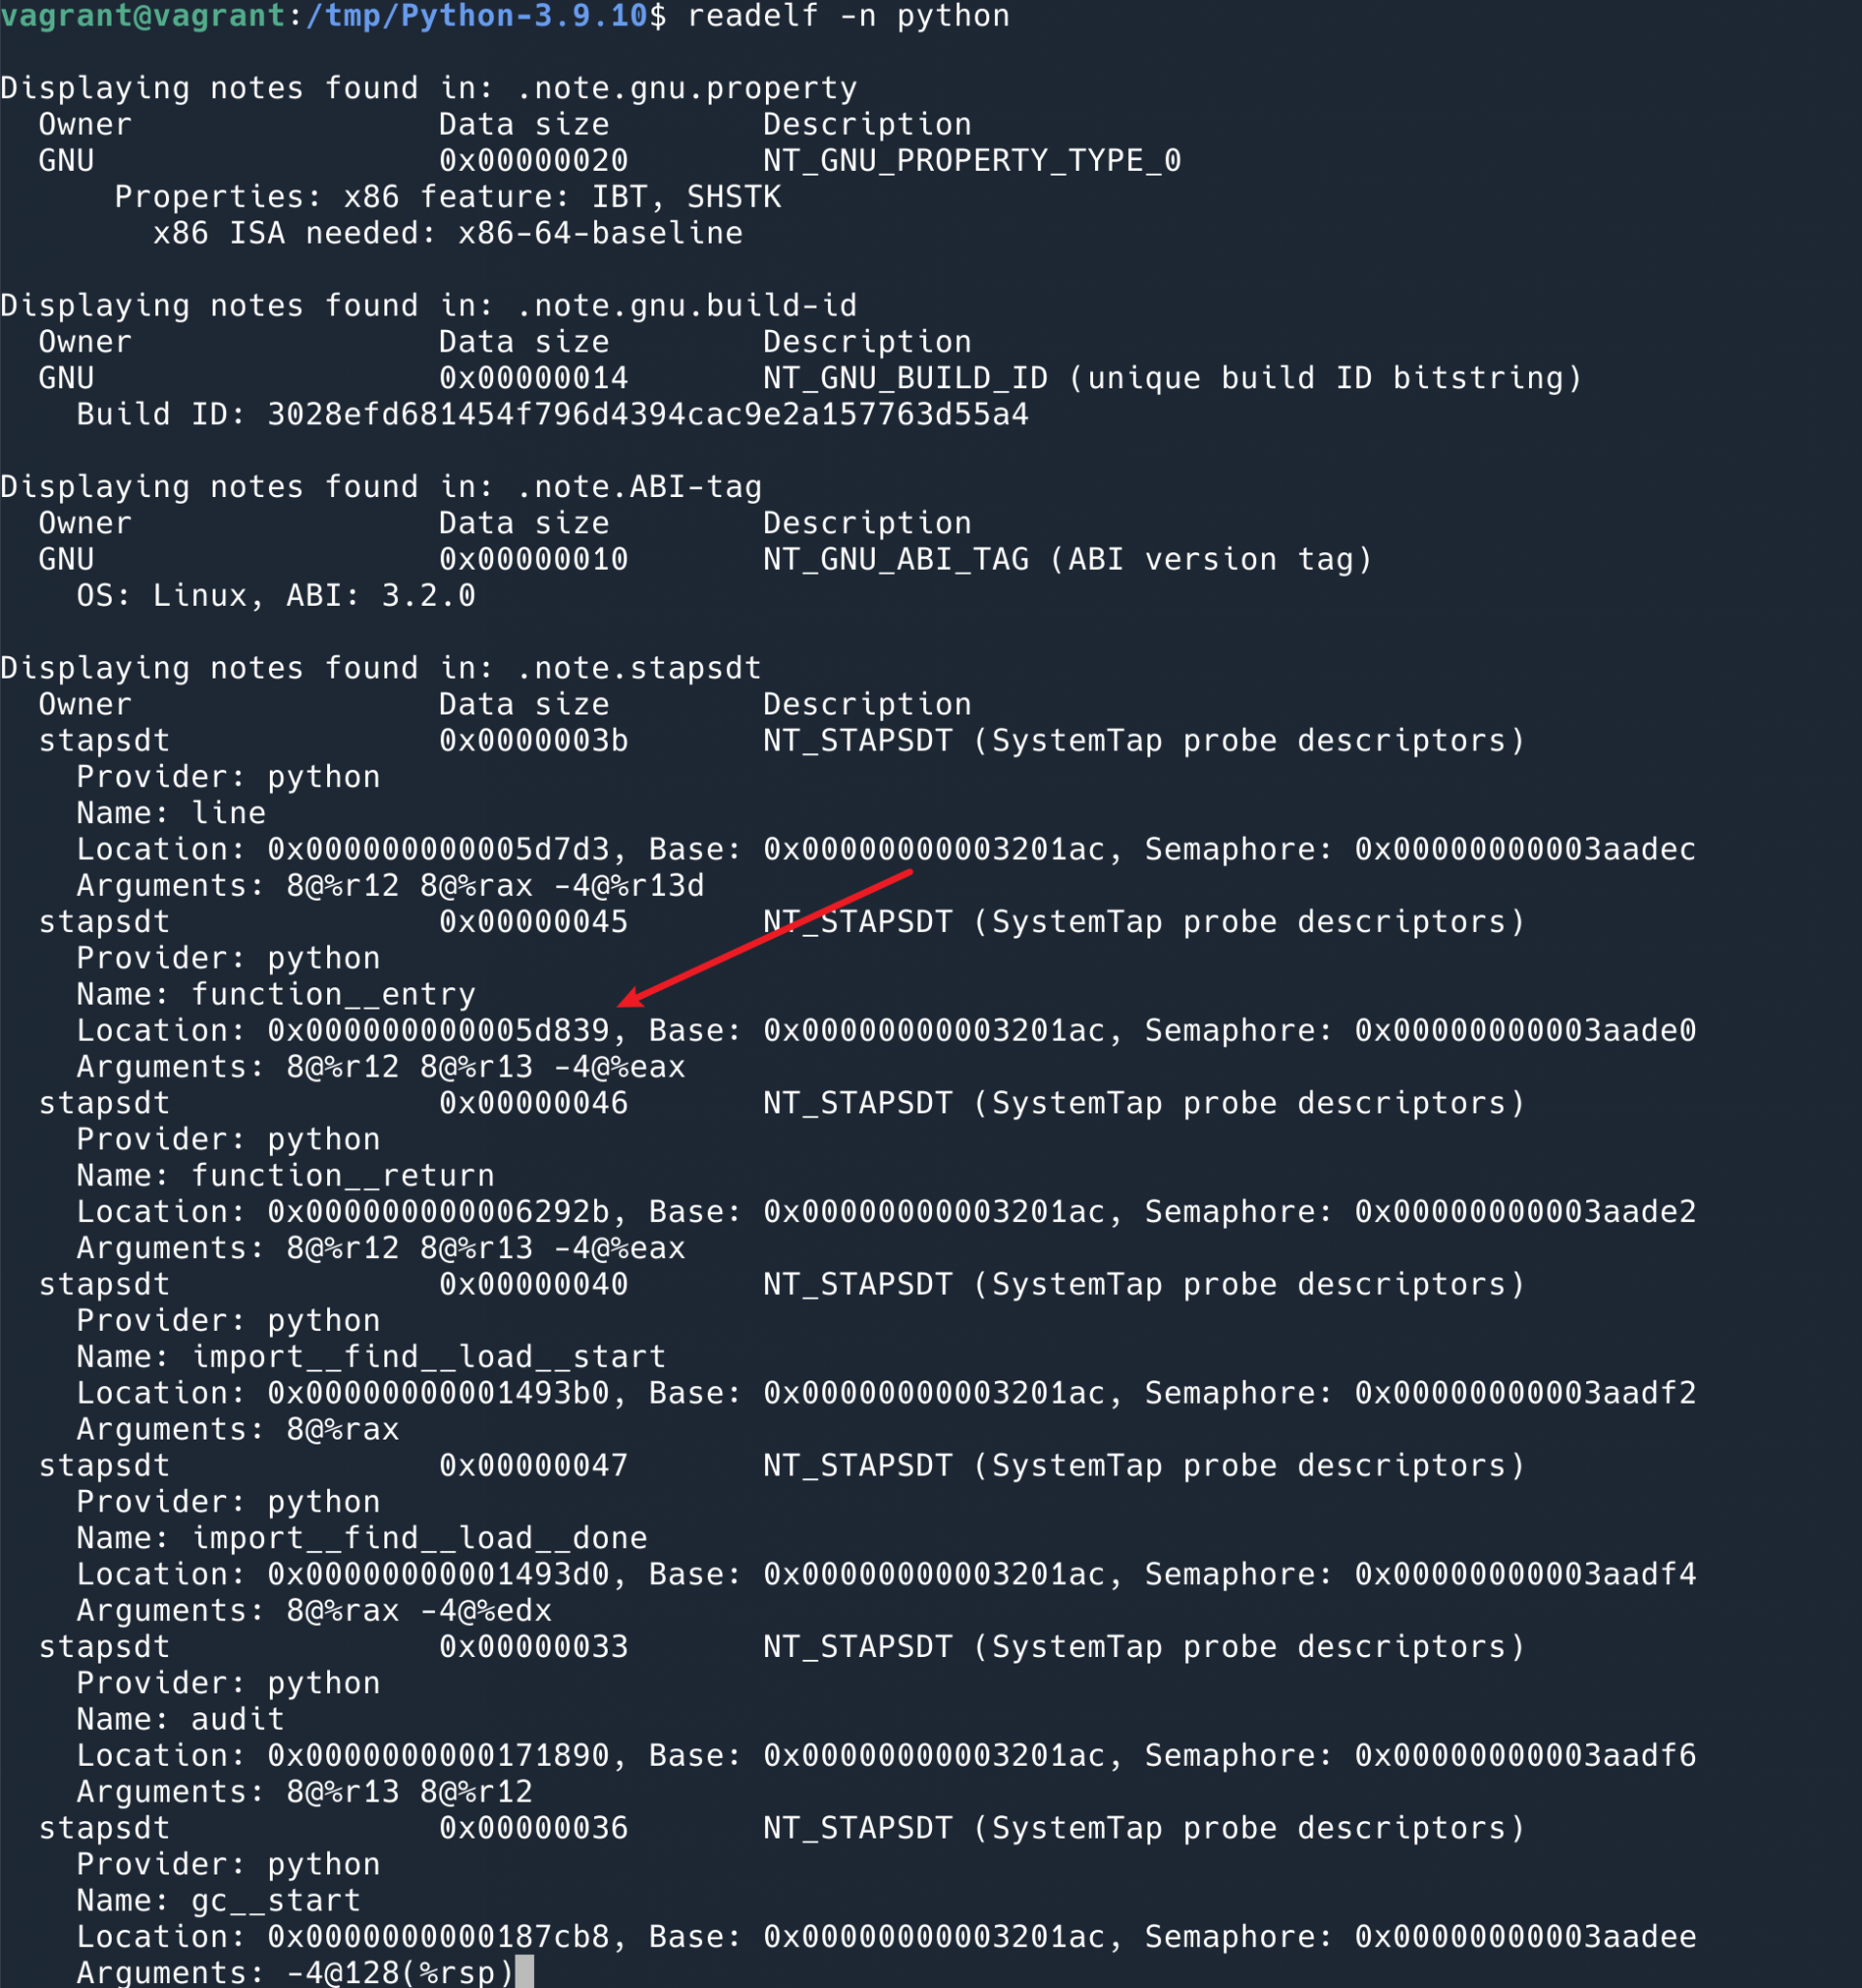
You can see that the location of the function__entry we just used is 0x000000000005d839.
Then we find the command at this location.
gpb -p 17577 to attach to the pid that is running. Then we run info proc mappings to dump the address and we can see that Offset 0x0 is at 0x55bfcc88d000.
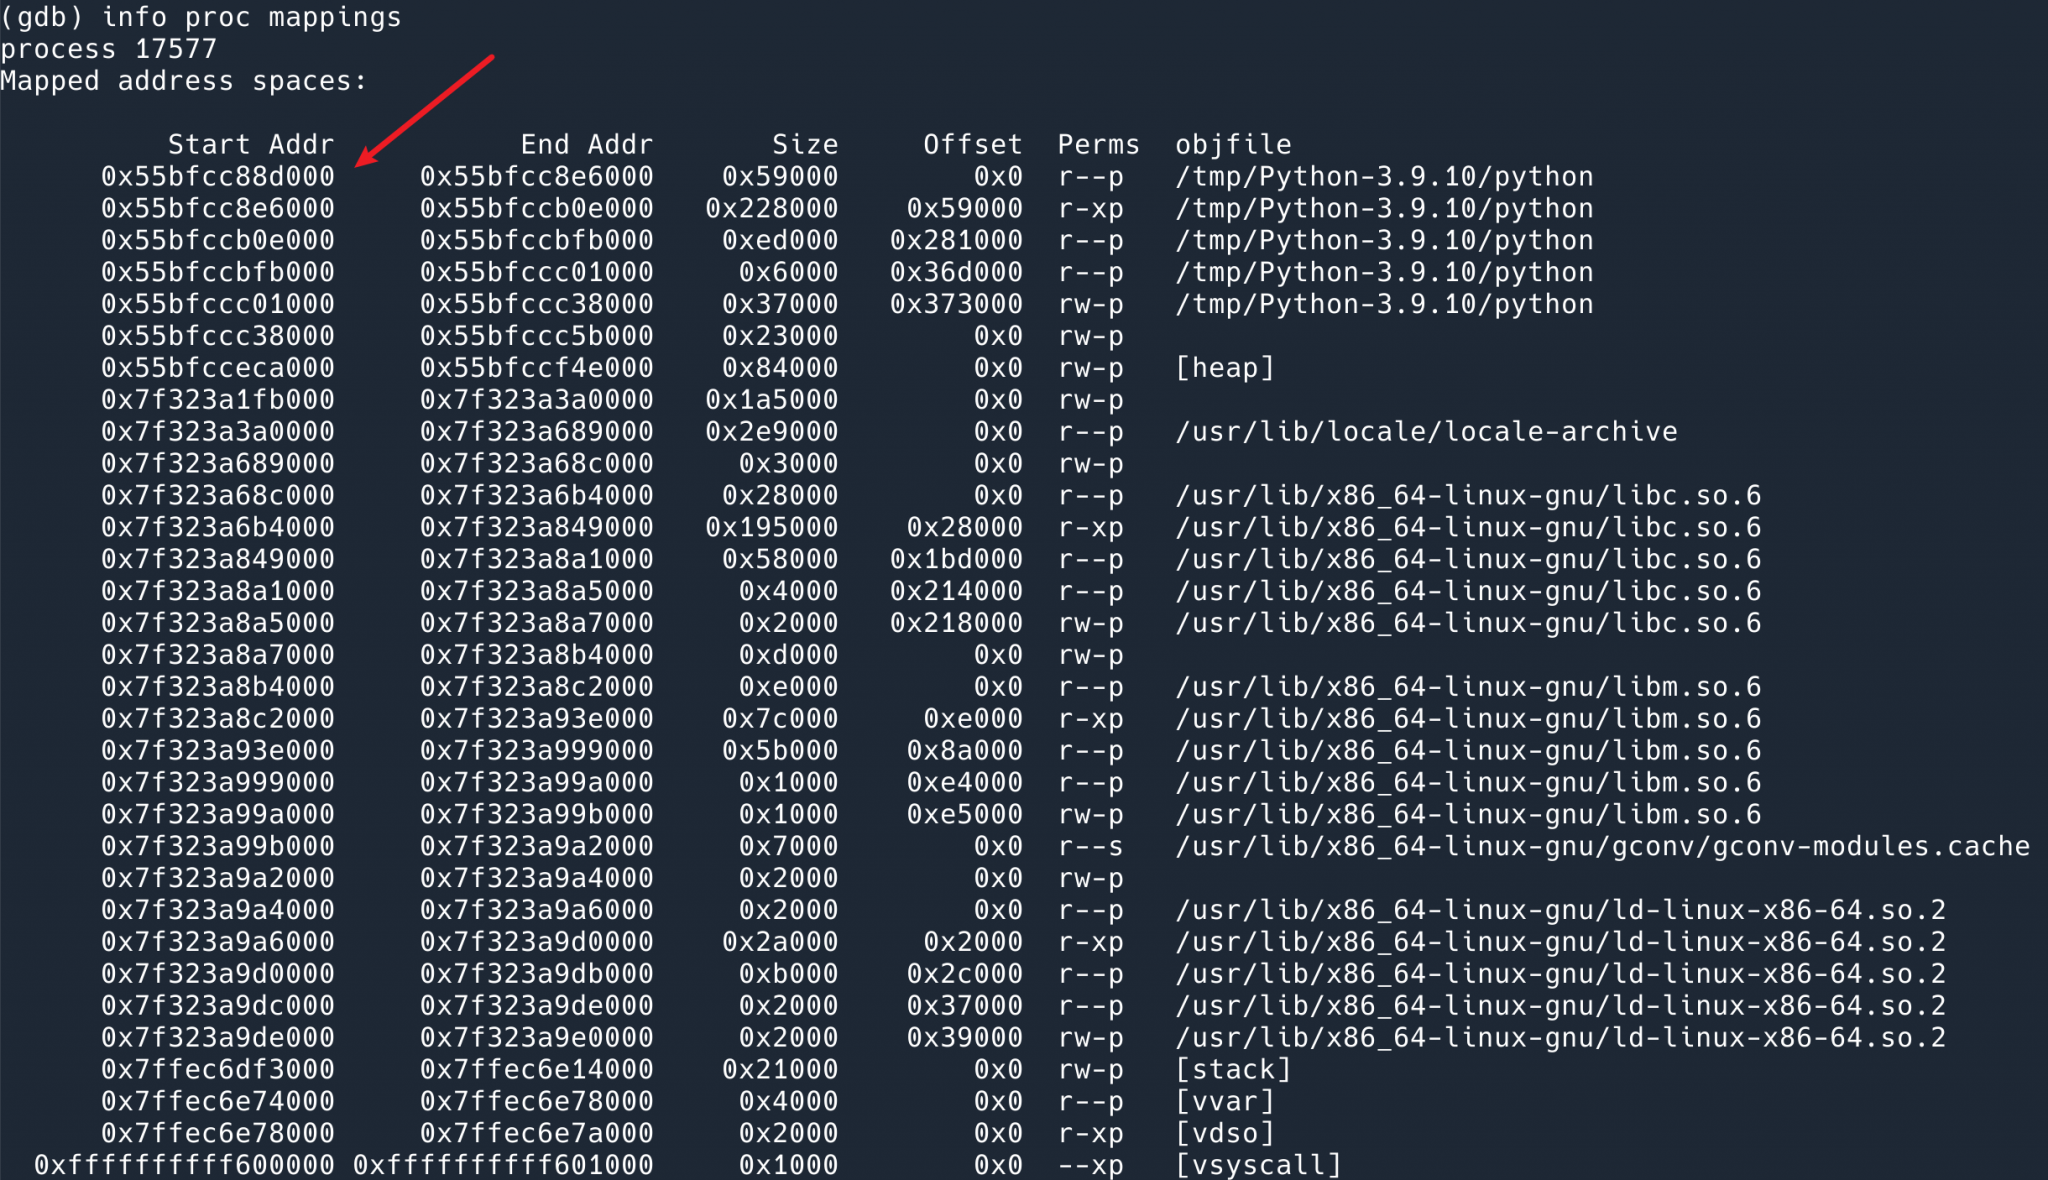
Then the location of function__entry should be 0x000000000005d839 + 0x55bfcc88d000.
The following command with disas will dump the instructions for this address.
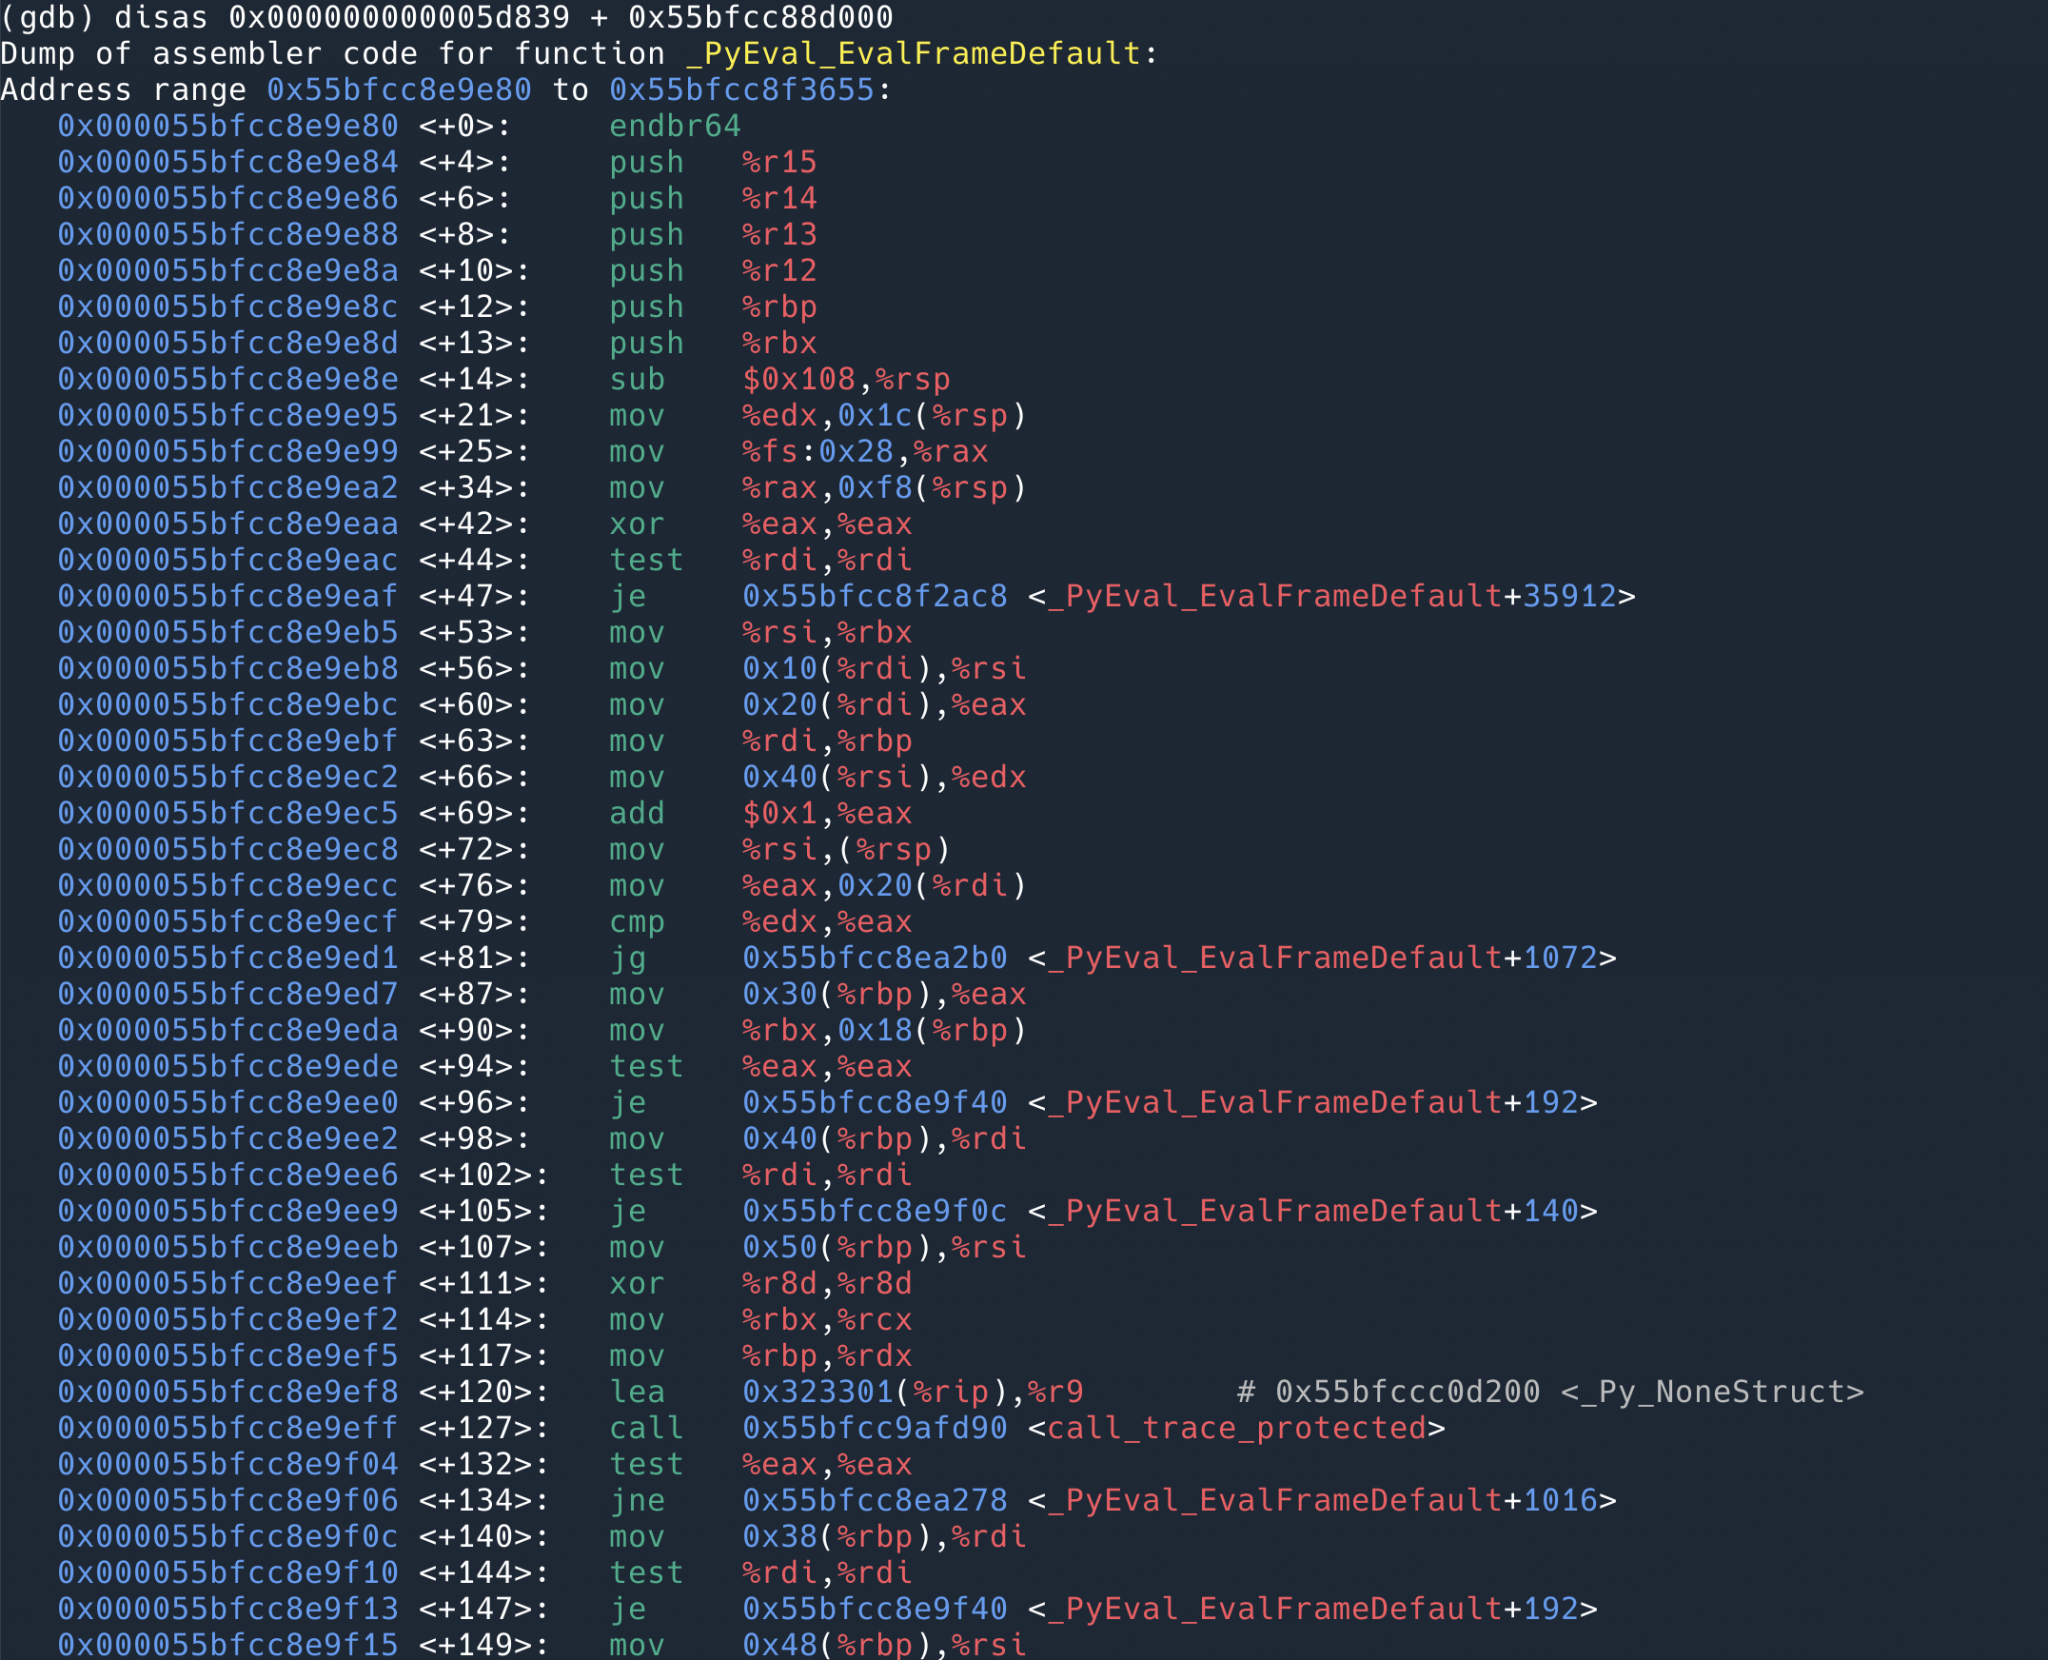
Find the instruction for the address 0x55bfcc8ea839.
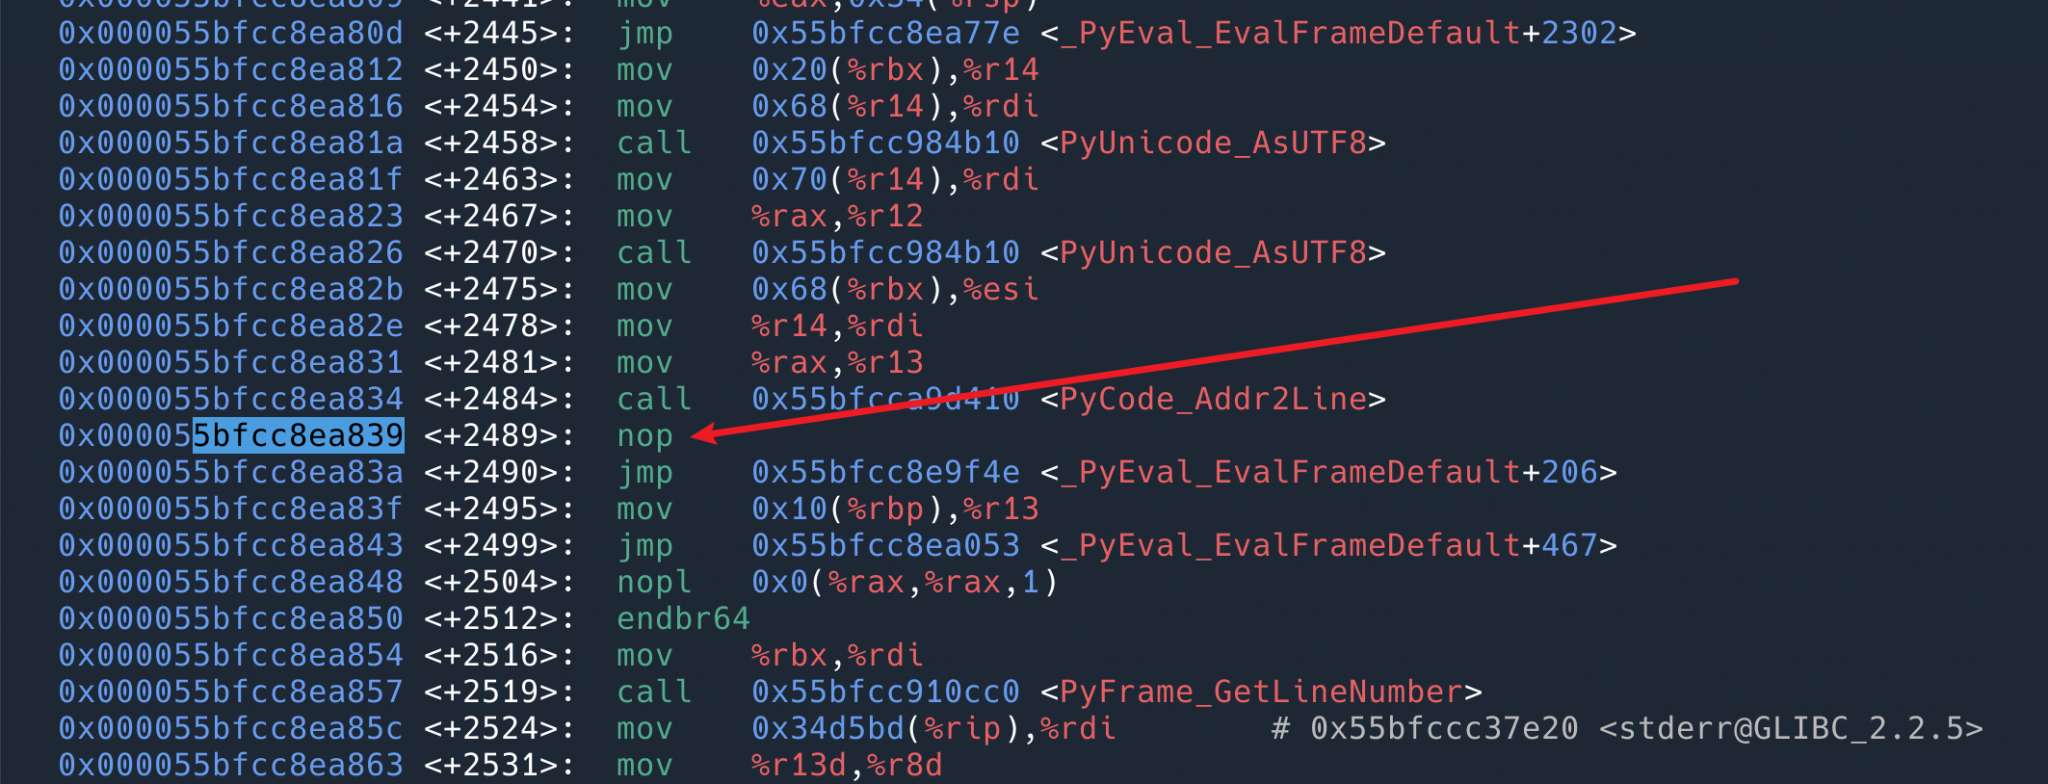
found to be a nop, i.e. doing nothing. So that’s why it says above that there is no loss of performance at all when usdt is not on. It’s just one more placeholder instruction that does nothing.
Use the previous command to attach the usdt probe.
Then revisit the instruction at this location 0x55bfcc8ea839.
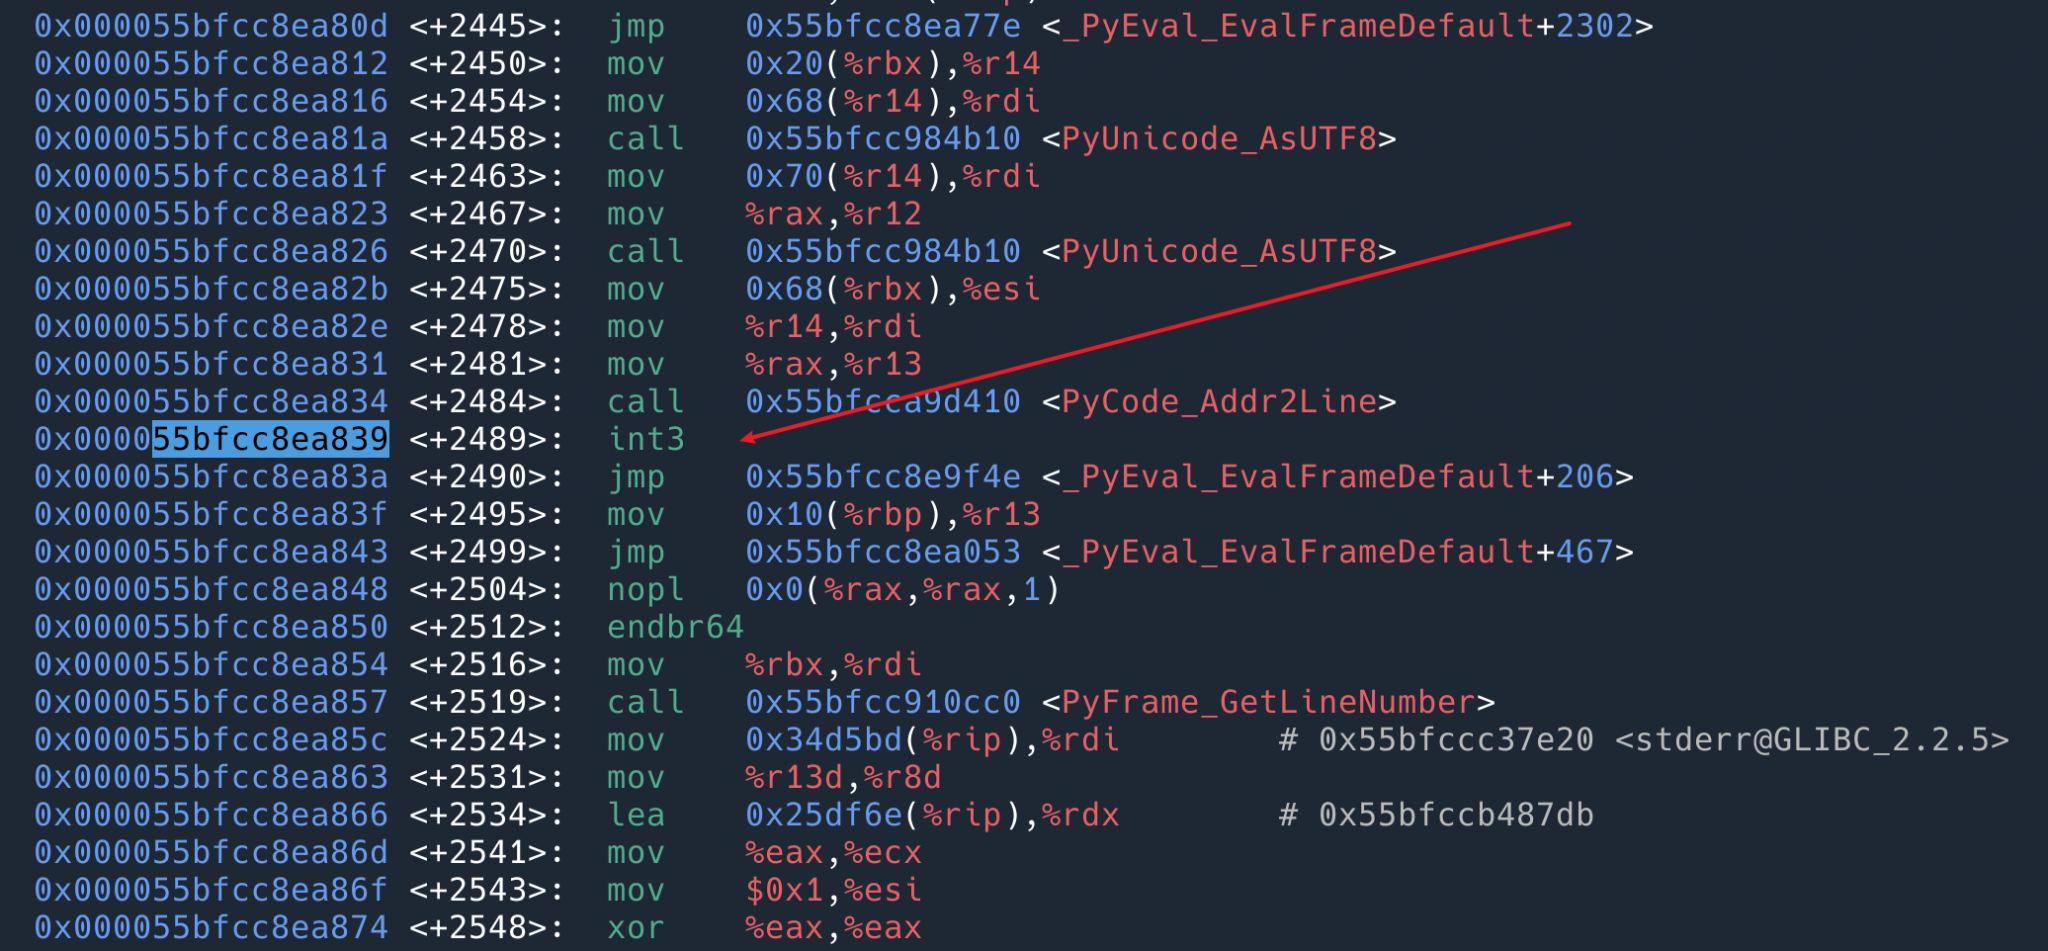
You can see that the instruction at this location has become int3 . When the program (interpreter) executes here, the kernel executes our BPF program with the variables provided by usdt. When the BPF probe exits, int3 will be restored to nop .
More possibilities?
Most of the Python related BPF content on the web is “how to use BPF with Python (BCC)”, not “how to profile Python code with BPF”. Maybe it’s not used much in interpreted languages.
USDT has the limitation that it can only use a few probes defined by the Python interpreter, and what it can do is basically see what the interpreter is doing, but not the parameters of some specific variables, the state of the interpreter, and so on. If we want to do more fine-grained dynamic tracing, we have two ideas.
- use uprobe to track the Python interpreter. But most of them are
PyObjectpointers, which require an understanding of how the interpreter works and are a bit complicated. - Customizing more USDT, with python-stapsdt, a library that allows you to insert more USDT markers into your Python program, doesn’t make much sense to me: we’re trying to solve problems, and often we don’t know where the problem is, and you can’t stop the program when you’re trying to solve it, and then it’s too late to remember to insert markers. In other words, since observability is very important when you know that a place can go wrong, why not just print the log?
Ref
https://www.kawabangga.com/posts/4894