Golang introduced PGO (Profile-guided optimization) in 1.20, which according to the official blog could achieve a 2%-7% performance improvement without changing the code. In the 1.21 Release Note, Golang upgraded this feature to GA and enabled PGO in its own builds, improving the performance of Golang’s own compiler by 2%-4%.
PGO itself is a compiler optimisation approach, not language specific, and Golang has only very tentatively applied PGO so far; this article will explore how PGO works, possible optimisations, and an example of using PGO to optimise the Linux Kernel.
PGO in General
Static compiled languages are generally considered to run better than dynamic interpreted languages. However, with the introduction of JIT (Just In Time) technology, dynamic languages have seen a dramatic improvement in performance, as JIT can be enhanced based on runtime conditions.
Example:
- Hotspot code compiled into machine code
- function inlining
- branch prediction
- loop expansion
- type inference
- Memory allocation optimisation
- Register Optimization
The JIT can achieve performance close to that of compiled languages through a series of runtime optimisations, and in some cases even better than compiled languages due to the ability to dynamically make optimisations that cannot be confirmed during compilation. For example, the rules for inlining functions in Golang are written dead, depending on the size of the function rather than how often it is used. Branch prediction and loop expansion compilers are also unable to do ad hoc optimizations because they do not know the frequency distribution of branch runtimes. The initialization size of Slice and Map in Golang needs to be specified manually via parameters or automatically scaled according to the write-dead rules, and cannot be assigned a proper initialization size based on runtime information.
A natural idea is to apply JIT-like techniques to compiled languages to optimise code performance through runtime information. The traditional approach is to actively add compilation hints to the code to help the compiler optimise it through human experience of understanding runtime, such as inline functions in C++, macros in C, and likely/unlikely provided by GCC.
|
|
There are several problems with this approach:
- it requires consideration of all branches and functions, which is a lot of work and complicated to adjust.
- it relies on the programmer’s experience, which may not always match the actual scenario.
- it is easier to adjust only the code that you have written, but it is difficult to adjust some dependent library functions, e.g. an application developer may need to adjust downwards to the glibc code.
Could there be a way to automatically optimise the compilation of code globally based on runtime information, without tweaking the code? This method is PGO, which collects runtime Profile information and optimises the compilation process in turn.
A typical workflow using PGO is divided into the following steps:
- Build the initial version of the binary without any PGO optimisations.
- Collect Profile information in the production environment.
- Rebuild the binary and use the Profile information collected in 2 for build optimisation.
- Go back to 2 and iterate continuously.
Google has implemented continuous PGO with AutoFDO, and also described the problems with PGO.
- The need to work with pprof information, a full Profile for production environments can lead to performance degradation, usually at the expense of accuracy by using samples, with an overhead of 1%.
- The need to dynamically adjust the Profile with the code is not a one-off optimization, the Profile information can be compromised, and it is a challenge to build a complete process.
- Limited overall performance improvement, with overall performance optimisation at around 10%.
- Increased binary size.
PGO in Golang
Golang currently has two main compilers, gc (go compiler) and gccgo.
-
gc
Advantages:
- official support
- good compatibility
- fast compilation speed
Disadvantages:
- more conservative optimization
-
gccgo
Advantages:
- more optimization capabilities with GCC for better performance
- More CPU architectures and systems can be supported
Disadvantages:
- follows the GCC release, does not support new Golang features, potential compatibility issues
- complicated to install and use
- slow compilation speed
gccgo uses a separate front and back-end architecture, the back-end already supports PGO and the main focus here is on the official gc PGO optimisation.
Collecting Profile Information
Golang’s PGO currently only supports optimizations via CPU Profile. We can collect CPU Profile information via runtime/pprof or net/http/pprof in the Golang standard library, or if the data from other Profile collectors can be converted to Google pprof is also compatible.
Note that since PGO uses a JIT-like optimization method, it is best to collect the Profile information in a real production environment to best match the actual running conditions of the program and to facilitate later optimization. It is also possible to merge Profile information collected on multiple machines go tool pprof -proto a.pprof b.pprof > merged.pprof .
Compile Optimisation
go build -gpo=/tmp/foo.pprof can be optimised during compilation with Profile information. Golang currently only implements function inlining optimisation, trying to inline functions with a call ratio greater than 2%.
More optimizations are only expected and can be found at https://github.com/golang/go/issues/55022#issuecomment-1245605666.
I may be lacking imagination, but I don’t see the scope of this going much beyond inline decisions.
To add to what others have said, we’ve actually been keeping an eye toward many possible PGO-based optimizations while designing this. Here’s a non-exhaustive list:
- Inlining just seems like the obvious first step, since it’s likely to provide a lot of bang for your buck. We’ve been talking about using PGO for inlining for many, many years. :)
- Local basic block ordering: ordering blocks within a function to cluster hot blocks and potentially improve branch prediction (though the win of the latter on modern CPUs is small).
- Register allocation: register allocation currently uses heuristics to determine a hot path and move spills off that hot path. PGO can tell it the true hot path.
- Function ordering: Clustering functions at a whole-binary level for better locality.
- Global block ordering: A step beyond function ordering. The basic form of this is hot/cold splitting, but it can be more aggressive than that.
- Indirect call devirtualization: If the profile shows that a particular function is by far the most common target of an indirect call, specialize the caller to check that that’s the target and make a direct call if it is (possibly even inlining the target). (Edit: Note that this would apply to both closure calls and interface method calls.)
- Stenciling: Stencil hot generic functions, possibly based on type information from the profile.
- Map/slice pre-sizing: Pre-size maps and slices based on allocation site. (This requires more than a CPU profile.)
- Lifetime allocation: Co-locate allocations with similar lifetimes by allocation site. (This also requires more than a CPU profile.)
A common scenario in practice is that a profile is not recompiled directly after it is run, but rather compiled and released after the next code change. The problem with this is that there are differences between the information in the profile and the code, and Golang currently uses some heuristic rules to work as well as possible in cases where the code and the profile do not match.
PGO for Kernel
PGO is generally used for application performance optimisation, but some server applications may be system call intensive, in which case you can actually PGO the kernel to create a kernel that is optimised for the application. Here you can refer to the work of one of my labmates when I was at school Profile-Guided Operating System Kernel Optimization, which is how I learned about PGO at that time.
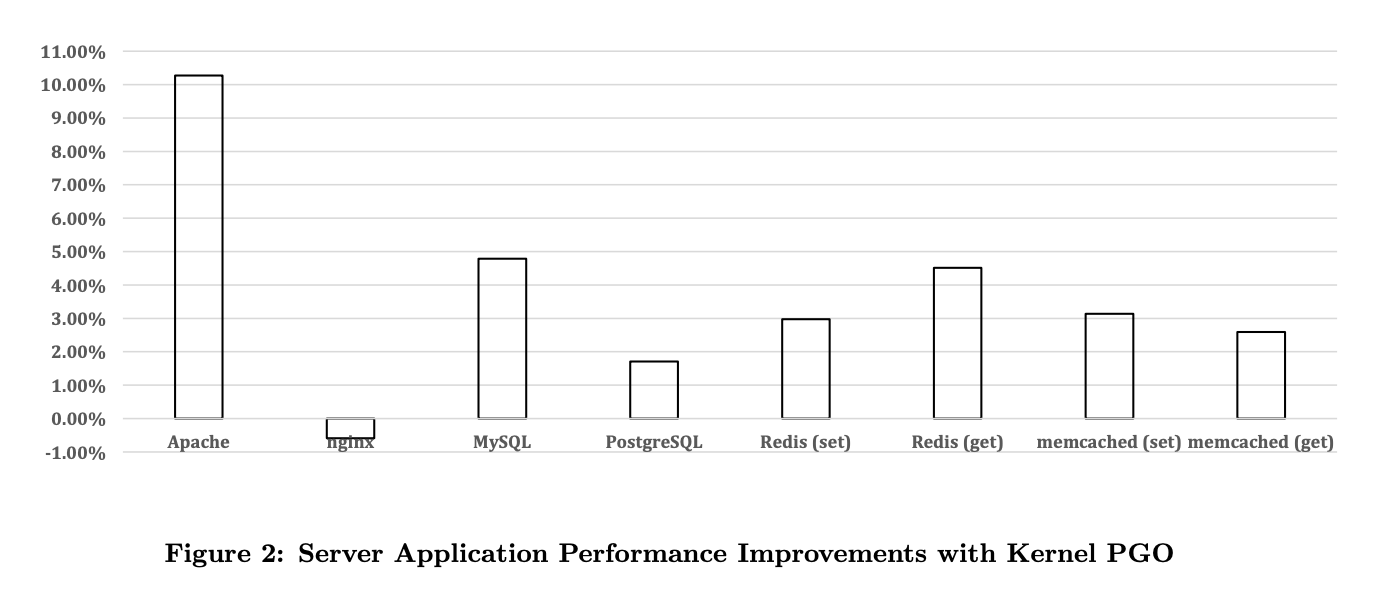
The image shows the throughput improvement of different software after optimisation, you can see that without touching the application code at all, just optimising the compilation of the kernel, there is a 2% to 10% improvement in throughput. In the case of Nginx there was a performance drop, which I remember him saying was due to a bug in GCC’s PGO that caused a faulty optimisation.
Summary
PGO is a way to get performance optimisation without changing the code, and works well with Golang’s pprof, but the degree of optimisation is accordingly limited and requires a release go-live process, so it can be used as a performance optimisation experiment.
Ref
https://oilbeater.com/2023/06/24/optimization-without-changing-code-pgo/