GeoPandas Introduction
GeoPandas is an open source project that aims to make it easier to work with geospatial data under Python. GeoPandas extends the pandas data type to allow spatial operations on geometric types. Geometric operations are performed by shapely. GeoPandas further relies on fiona for file access and descartes, matplotlib for plotting.
GeoPandas follows the data types of pandas, so there are also two data types in GeoPandas.
- GeoSeries
- GeoDataFrame
They are subclasses of Series and DataFrame in Pandas, respectively, and inherit most of the methods of the Pandas data structure.
GeoSeries
GeoSeries are sequences containing collections of shapes, each element can be a single shape or multiple shapes. geopandas have three basic types of geometric objects.
- Points: Points/Multi-Points
- Lines: Lines/Multi-Lines
- Facets: Polygons/Multi-Polygons
All entries in a GeoSeries do not have to have the same geometry type; some operations may fail if they are of different types.
The Geoseries class implements almost all the properties and methods of the Shapely object. When using GeoSeries, it will be applied to each element of all geometries in the sequence. A binary operation can be performed between two GeoSeries objects, in which case the binary operation will be applied to each element. The two sequences will be operated on by matching indexes. The binary operation can also be applied to a single geometry, in which case the binary operation will be performed on each element of the geometry sequence. In both cases, the operation will return a Series or GeoSeries object.
Attributes Attributes
- area: Returns a Series that contains the area of each geometry in the GeoSeries.
- bounds: Returns a DataFrame containing the bounds of each geometry, represented by the column values minx, miny, maxx, maxy.
- total_bounds: Returns a tuple containing the minx,miny,maxx,maxy values for the entire series bounds. Bounds of the geometry contained in the series.
- geom_type: Returns a string for the series, the string specifies the geometry type of each object.
- is_valid: Returns a Series of boolean type, which is True if the geometry is valid.
Basic Methods basic methods
- distance(): Returns a Series that contains the minimum distance to other GeoSeries objects (per element) or geometric objects.
- centroid: Returns a GeoSeries that represents the geometry’s center of gravity point.
- representative_point(): Returns one GeoSeries of all points (calculated on the fly) that must be guaranteed to be in the interior of each geometry. This point is not equal to the center of gravity.
- to_crs(): Converts the geometry in the GeoSeries to a different coordinate reference system. The crs attribute of the current GeoSeries must be set. crs attribute needs to be specified for output, either in dictionary form or in EPSG encoding.
- plot(): Plots the geometry of the GeoSeries.
Relationship Tests relationship tests
- geom_almost_equals(): Returns a boolean Series object, which is True if all points of each object are approximately equal to each other at the specified fractional precision.
- contains(): Returns a Boolean Series object that is True if the interior of each object contains the interiors and bounds of the other objects and their bounds are not contiguous.
- intersects(): Returns a Boolean Series that is True if the boundaries and interiors of each object intersect other objects in any other form.
GeoDataFrame
A GeoDataFrame is a list data structure that contains a column called containing geometry, which contains a GeoSeries.
GeoPandas installation
GeoPandas is relatively easy to install under Linux, just execute: pip install geopandas
However, installation under Windows usually results in the following error.
|
|
Main content install GDAL and fiona times error by installing dependency libraries.
Solution 1: If you are using anaconda, you can install geopandas by conda
Solution 2: Download the compiled GDAL and fiona package to install, download address: https://www.lfd.uci.edu/~gohlke/pythonlibs/
Use of GeoPandas
To display the world map.
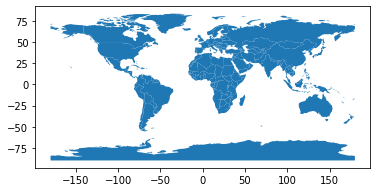
GeoPandas’ read_file method can read almost any vector-based spatial data format, including ESRI shapefiles, GeoJSON files, etc. geopandas.datasets.get_path(’naturalearth_lowres ‘) gets the shapefile file of the world map from GeoPandas’ own dataset. The data style is as follows.
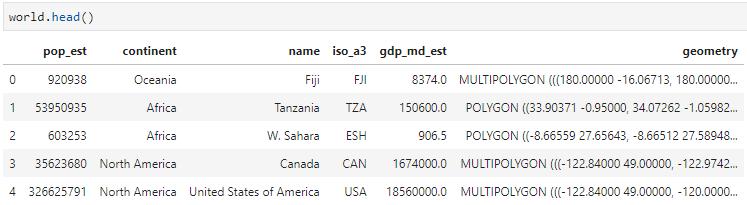
In this data column, there are not only geometry columns, but also other attribute columns such as: pop_est (population), continent (continent), name (region name), iso_a3 (country/region three character code), gdp_md_est(), etc.
It is also possible to export GeoDataFrame as ESRI shapefile, GeoJson, GeoPackage and other geospatial file types:.
Show the center point of each country.
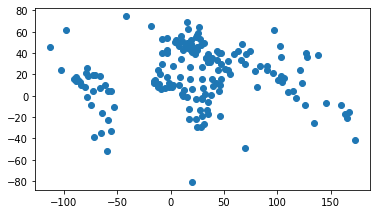
world.centroid returns a GeoSeries containing the spatial data of the centroids of each region. The .set_geometry function then sets the new columns to geometry columns, so that the map will be displayed according to the new geometry columns.
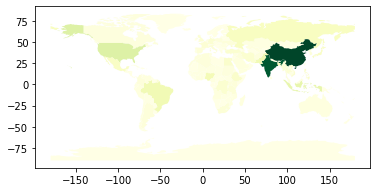
Display colors with different depths by population.
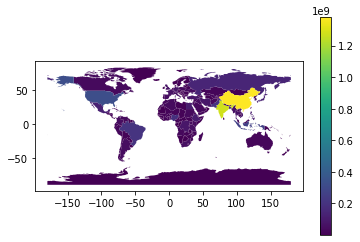
column sets the column to be displayed differently. legend=True sets whether to display the color scale. You can also set the color scheme of the displayed colors: https://matplotlib.org/tutorials/colors/colormaps.html
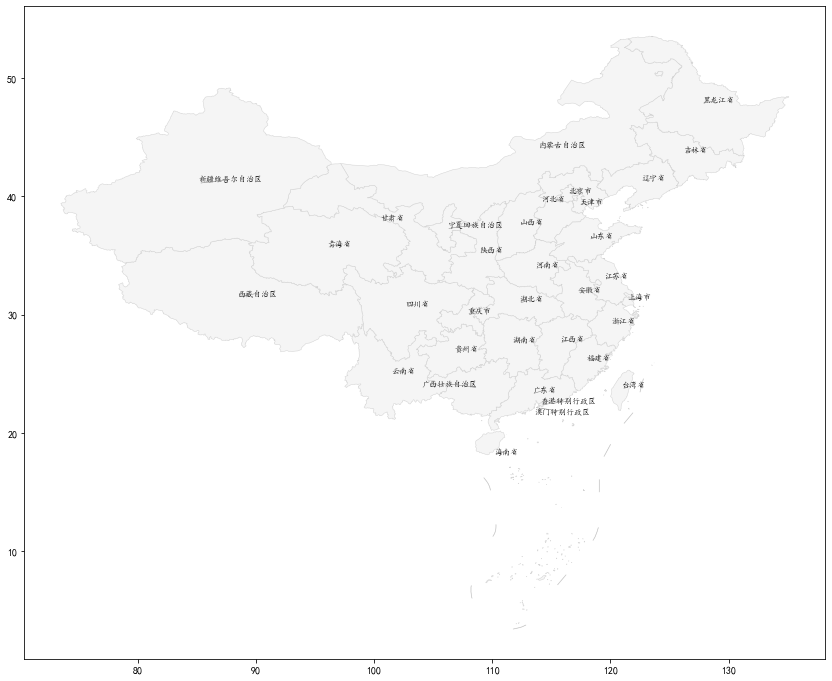
Adding text labels to GeoPandas regions
When plotting region data with GeoPandas, it is sometimes expected to add text labels to each day’s region. The main problem is that it is not possible to determine where the text labels should be added. Fortunately GeoPandas provides 2 methods that can help us to locate the text labels.
- Centroid: returns the center point of each polygon
- representative point(): returns a point inside the polygon, which is guaranteed to be inside the polygon’s boundary, but not necessarily in the center
Sample code.
|
|
Reference link.