Introduction to Mapbox
Founded in 2010 by Eric Gunderson, Mapbox has grown rapidly and has become a leader in the mapping renaissance. focused on providing custom base map blocks for map and application developers, Mapbox has positioned itself as the leading software company for web maps and mobile applications. In addition to the base map style toolset already widely used by program developers and cartographers, they also offer mapping tools written in Python and JavaScript. By combining these two languages in one package Mapbox has released the new “MapboxGL-Jupyter” Python module, which allows the creation of instant visualizations of data in the Jupter Notebook environment. In addition, Mapbox also provides the Mapbox Python SDK that allows API access to the account service.
MapboxGL.js
MapboxGL is based on Leaflet.js. Building on Leaflet, MapboxGL.js integrates with the WebGL library, which leverages HTML5 canvas tags to support Web graphics without plugins. MapboxGL.js supports vector slicing, as well as smooth scaling and panning for 3D environments. It supports GeoJSON overlays as well as markers and shapes. Events (including clicks, zooms and pans) can be used to trigger data processing functions, making it ideal for interactive web mapping applications.
Mapbox Python SDK
The Mapbox Python SDK is used to access most Mapbox services, including directions, geocoding, analytics, and datasets. The underlying access to cloud-based services supports data editing and uploading, system management, and location-based queries, allowing organizations to integrate and extend them with native GIS. Although the MapboxGL-Jupter tool does not rely on this SDK, it is very useful for data uploads and queries.
Use of Mapbox
Official sample code.
|
|
Execution result: The coordinate points are not shown on the map. The following figure.
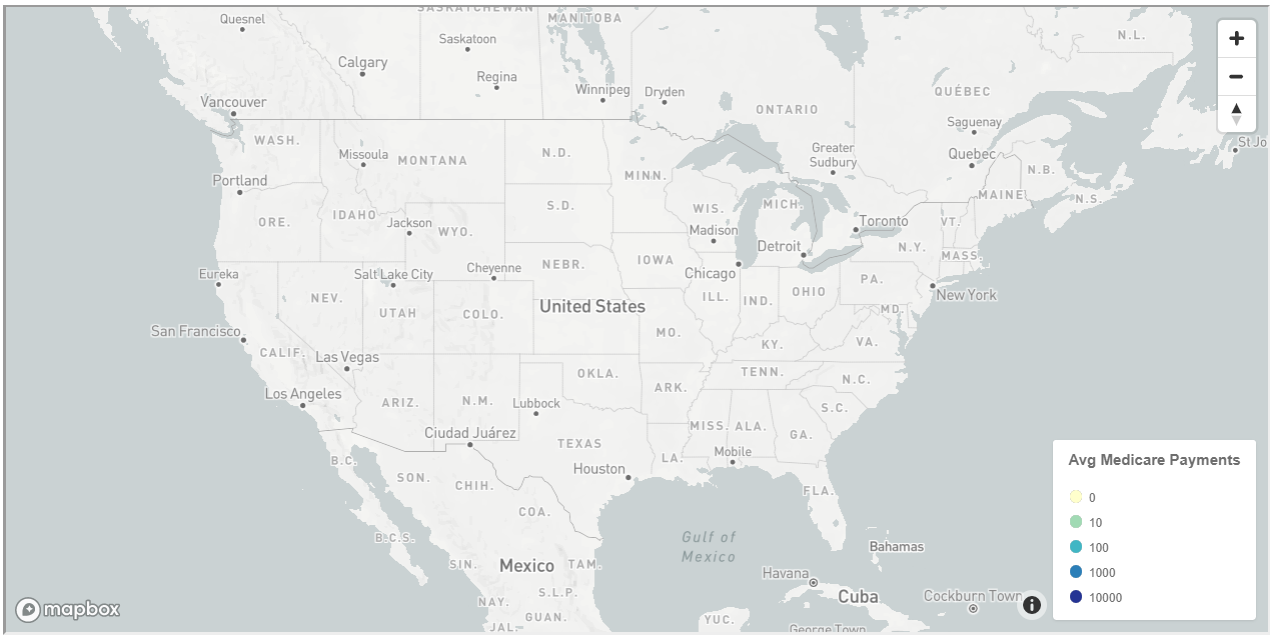
The reason for this is that the ‘points.geojson’ file read by CircleViz is not read by a relative path, but by a spliced URL, i.e. the request URL is: 127.0.0.1:8888/points.geojson, so it will result in the following error.
|
|
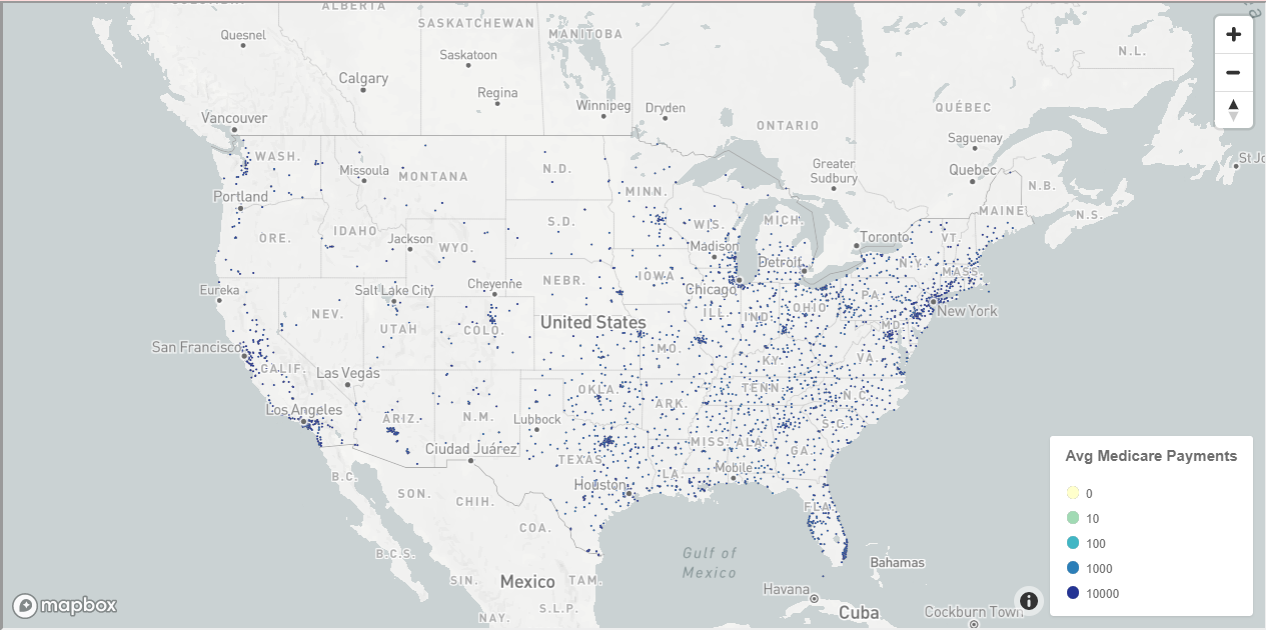
Solution: Store the points.geojson file in memory instead of directly as a file:
|
|
Implementation results.
More usage examples.
- Categorical points
- All visualization types
- Choropleth Visualization types
- Image Visualization types
- Raster Tile Visualization types
Personal summary: the overall functionality does not lose folium, including heat maps, Choropleth maps, etc. are supported, and also supports custom tiles. Mainly Sean Gillies, the head of Mapbox open source, is the main developer of Shapely, Fiona and Rasterio. Vladimir Agafonkin, developer of Leaflet, has been working for Mapbox since 2013.
Reference links.