In this section we will install and configure Filebeat to collect log data from a Kubernetes cluster and send it to ElasticSearch, Filebeat is a lightweight log collection agent that can also be configured with specific modules to parse and visualize the log format of applications (e.g., databases, Nginx, etc.).
Similar to Metricbeat, Filebeat requires a configuration file to set the link information to ElasticSearch, the connection to Kibana, and the way logs are collected and parsed.
The ConfigMap resource object shown below is the configuration information we use here for log collection (the full configurable information is available from the official website)
 1
 2
 3
 4
 5
 6
 7
 8
 9
10
11
12
13
14
15
16
17
18
19
20
21
22
23
24
25
26
27
28
29
30
31
32
33
34
35
36
37
38
39
40
41
42
43
44
45
46
47
48
49
50
51
52
53
54
55
56
57
58
59
60
61
62
63
64
65
66
67
68
69
70
71
72
73
74
|
# filebeat.settings.configmap.yml
---
apiVersion: v1
kind: ConfigMap
metadata:
  namespace: elastic
  name: filebeat-config
  labels:
    app: filebeat
data:
  filebeat.yml: |-
    filebeat.inputs:
    - type: container
      enabled: true
      paths:
      - /var/log/containers/*.log
      processors:
      - add_kubernetes_metadata:
          in_cluster: true
          host: ${NODE_NAME}
          matchers:
          - logs_path:
              logs_path: "/var/log/containers/"

    filebeat.autodiscover:
      providers:
        - type: kubernetes
          templates:
            - condition.equals:
                kubernetes.labels.app: mongo
              config:
                - module: mongodb
                  enabled: true
                  log:
                    input:
                      type: docker
                      containers.ids:
                        - ${data.kubernetes.container.id}

    processors:
      - drop_event:
          when.or:
              - and:
                  - regexp:
                      message: '^\d+\.\d+\.\d+\.\d+ '
                  - equals:
                      fileset.name: error
              - and:
                  - not:
                      regexp:
                          message: '^\d+\.\d+\.\d+\.\d+ '
                  - equals:
                      fileset.name: access
      - add_cloud_metadata:
      - add_kubernetes_metadata:
          matchers:
          - logs_path:
              logs_path: "/var/log/containers/"
      - add_docker_metadata:

    output.elasticsearch:
      hosts: ['${ELASTICSEARCH_HOST:elasticsearch}:${ELASTICSEARCH_PORT:9200}']
      username: ${ELASTICSEARCH_USERNAME}
      password: ${ELASTICSEARCH_PASSWORD}

    setup.kibana:
      host: '${KIBANA_HOST:kibana}:${KIBANA_PORT:5601}'

    setup.dashboards.enabled: true
    setup.template.enabled: true

    setup.ilm:
      policy_file: /etc/indice-lifecycle.json
---
|
We configure to collect all the log data under /var/log/containers/ and use the inCluster schema to access the APIServer of Kubernetes to get the Meta information of the log data and send the logs directly to Elasticsearch.
The recovery policy for indice is also defined via policy_file.
 1
 2
 3
 4
 5
 6
 7
 8
 9
10
11
12
13
14
15
16
17
18
19
20
21
22
23
24
25
26
27
28
29
30
31
32
|
# filebeat.indice-lifecycle.configmap.yml
---
apiVersion: v1
kind: ConfigMap
metadata:
  namespace: elastic
  name: filebeat-indice-lifecycle
  labels:
    app: filebeat
data:
  indice-lifecycle.json: |-
    {
      "policy": {
        "phases": {
          "hot": {
            "actions": {
              "rollover": {
                "max_size": "5GB" ,
                "max_age": "1d"
              }
            }
          },
          "delete": {
            "min_age": "30d",
            "actions": {
              "delete": {}
            }
          }
        }
      }
    }
---
|
Also to collect log data on each node, we use a DaemonSet controller here to collect logs from the nodes using the above configuration.
 1
 2
 3
 4
 5
 6
 7
 8
 9
10
11
12
13
14
15
16
17
18
19
20
21
22
23
24
25
26
27
28
29
30
31
32
33
34
35
36
37
38
39
40
41
42
43
44
45
46
47
48
49
50
51
52
53
54
55
56
57
58
59
60
61
62
63
64
65
66
67
68
69
70
71
72
73
74
75
76
77
78
79
80
81
82
83
84
85
86
87
88
89
90
91
92
93
94
95
96
97
|
#filebeat.daemonset.yml
---
apiVersion: apps/v1
kind: DaemonSet
metadata:
  namespace: elastic
  name: filebeat
  labels:
    app: filebeat
spec:
  selector:
    matchLabels:
      app: filebeat
  template:
    metadata:
      labels:
        app: filebeat
    spec:
      serviceAccountName: filebeat
      terminationGracePeriodSeconds: 30
      containers:
      - name: filebeat
        image: docker.elastic.co/beats/filebeat:7.8.0
        args: [
          "-c", "/etc/filebeat.yml",
          "-e",
        ]
        env:
        - name: ELASTICSEARCH_HOST
          value: elasticsearch-client.elastic.svc.cluster.local
        - name: ELASTICSEARCH_PORT
          value: "9200"
        - name: ELASTICSEARCH_USERNAME
          value: elastic
        - name: ELASTICSEARCH_PASSWORD
          valueFrom:
            secretKeyRef:
              name: elasticsearch-pw-elastic
              key: password
        - name: KIBANA_HOST
          value: kibana.elastic.svc.cluster.local
        - name: KIBANA_PORT
          value: "5601"
        - name: NODE_NAME
          valueFrom:
            fieldRef:
              fieldPath: spec.nodeName
        securityContext:
          runAsUser: 0
        resources:
          limits:
            memory: 200Mi
          requests:
            cpu: 100m
            memory: 100Mi
        volumeMounts:
        - name: config
          mountPath: /etc/filebeat.yml
          readOnly: true
          subPath: filebeat.yml
        - name: filebeat-indice-lifecycle
          mountPath: /etc/indice-lifecycle.json
          readOnly: true
          subPath: indice-lifecycle.json
        - name: data
          mountPath: /usr/share/filebeat/data
        - name: varlog
          mountPath: /var/log
          readOnly: true
        - name: varlibdockercontainers
          mountPath: /var/lib/docker/containers
          readOnly: true
        - name: dockersock
          mountPath: /var/run/docker.sock
      volumes:
      - name: config
        configMap:
          defaultMode: 0600
          name: filebeat-config
      - name: filebeat-indice-lifecycle
        configMap:
          defaultMode: 0600
          name: filebeat-indice-lifecycle
      - name: varlog
        hostPath:
          path: /var/log
      - name: varlibdockercontainers
        hostPath:
          path: /var/lib/docker/containers
      - name: dockersock
        hostPath:
          path: /var/run/docker.sock
      - name: data
        hostPath:
          path: /var/lib/filebeat-data
          type: DirectoryOrCreate
---
|
We are using a cluster built by Kubeadm, the default Master node is tainted, so if you still want to collect the logs of the Master node, you must also add the corresponding tolerance, I do not collect here without adding the tolerance.
In addition, because of the need to obtain Meta information about the logs in the Kubernetes cluster, such as Pod names, namespaces, etc., Filebeat needs to access the APIServer, which naturally requires the corresponding RBAC permissions, so it also needs to make the following permission declaration.
 1
 2
 3
 4
 5
 6
 7
 8
 9
10
11
12
13
14
15
16
17
18
19
20
21
22
23
24
25
26
27
28
29
30
31
32
33
34
35
36
37
38
39
|
# filebeat.permission.yml
---
apiVersion: rbac.authorization.k8s.io/v1beta1
kind: ClusterRoleBinding
metadata:
  name: filebeat
subjects:
- kind: ServiceAccount
  name: filebeat
  namespace: elastic
roleRef:
  kind: ClusterRole
  name: filebeat
  apiGroup: rbac.authorization.k8s.io
---
apiVersion: rbac.authorization.k8s.io/v1beta1
kind: ClusterRole
metadata:
  name: filebeat
  labels:
    app: filebeat
rules:
- apiGroups: [""]
  resources:
  - namespaces
  - pods
  verbs:
  - get
  - watch
  - list
---
apiVersion: v1
kind: ServiceAccount
metadata:
  namespace: elastic
  name: filebeat
  labels:
    app: filebeat
---
|
Then it is straightforward to install and deploy several of the resource objects above.
 1
 2
 3
 4
 5
 6
 7
 8
 9
10
11
|
$ kubectl apply  -f filebeat.settings.configmap.yml \
                 -f filebeat.indice-lifecycle.configmap.yml \
                 -f filebeat.daemonset.yml \
                 -f filebeat.permissions.yml

configmap/filebeat-config created
configmap/filebeat-indice-lifecycle created
daemonset.apps/filebeat created
clusterrolebinding.rbac.authorization.k8s.io/filebeat created
clusterrole.rbac.authorization.k8s.io/filebeat created
serviceaccount/filebeat created
|
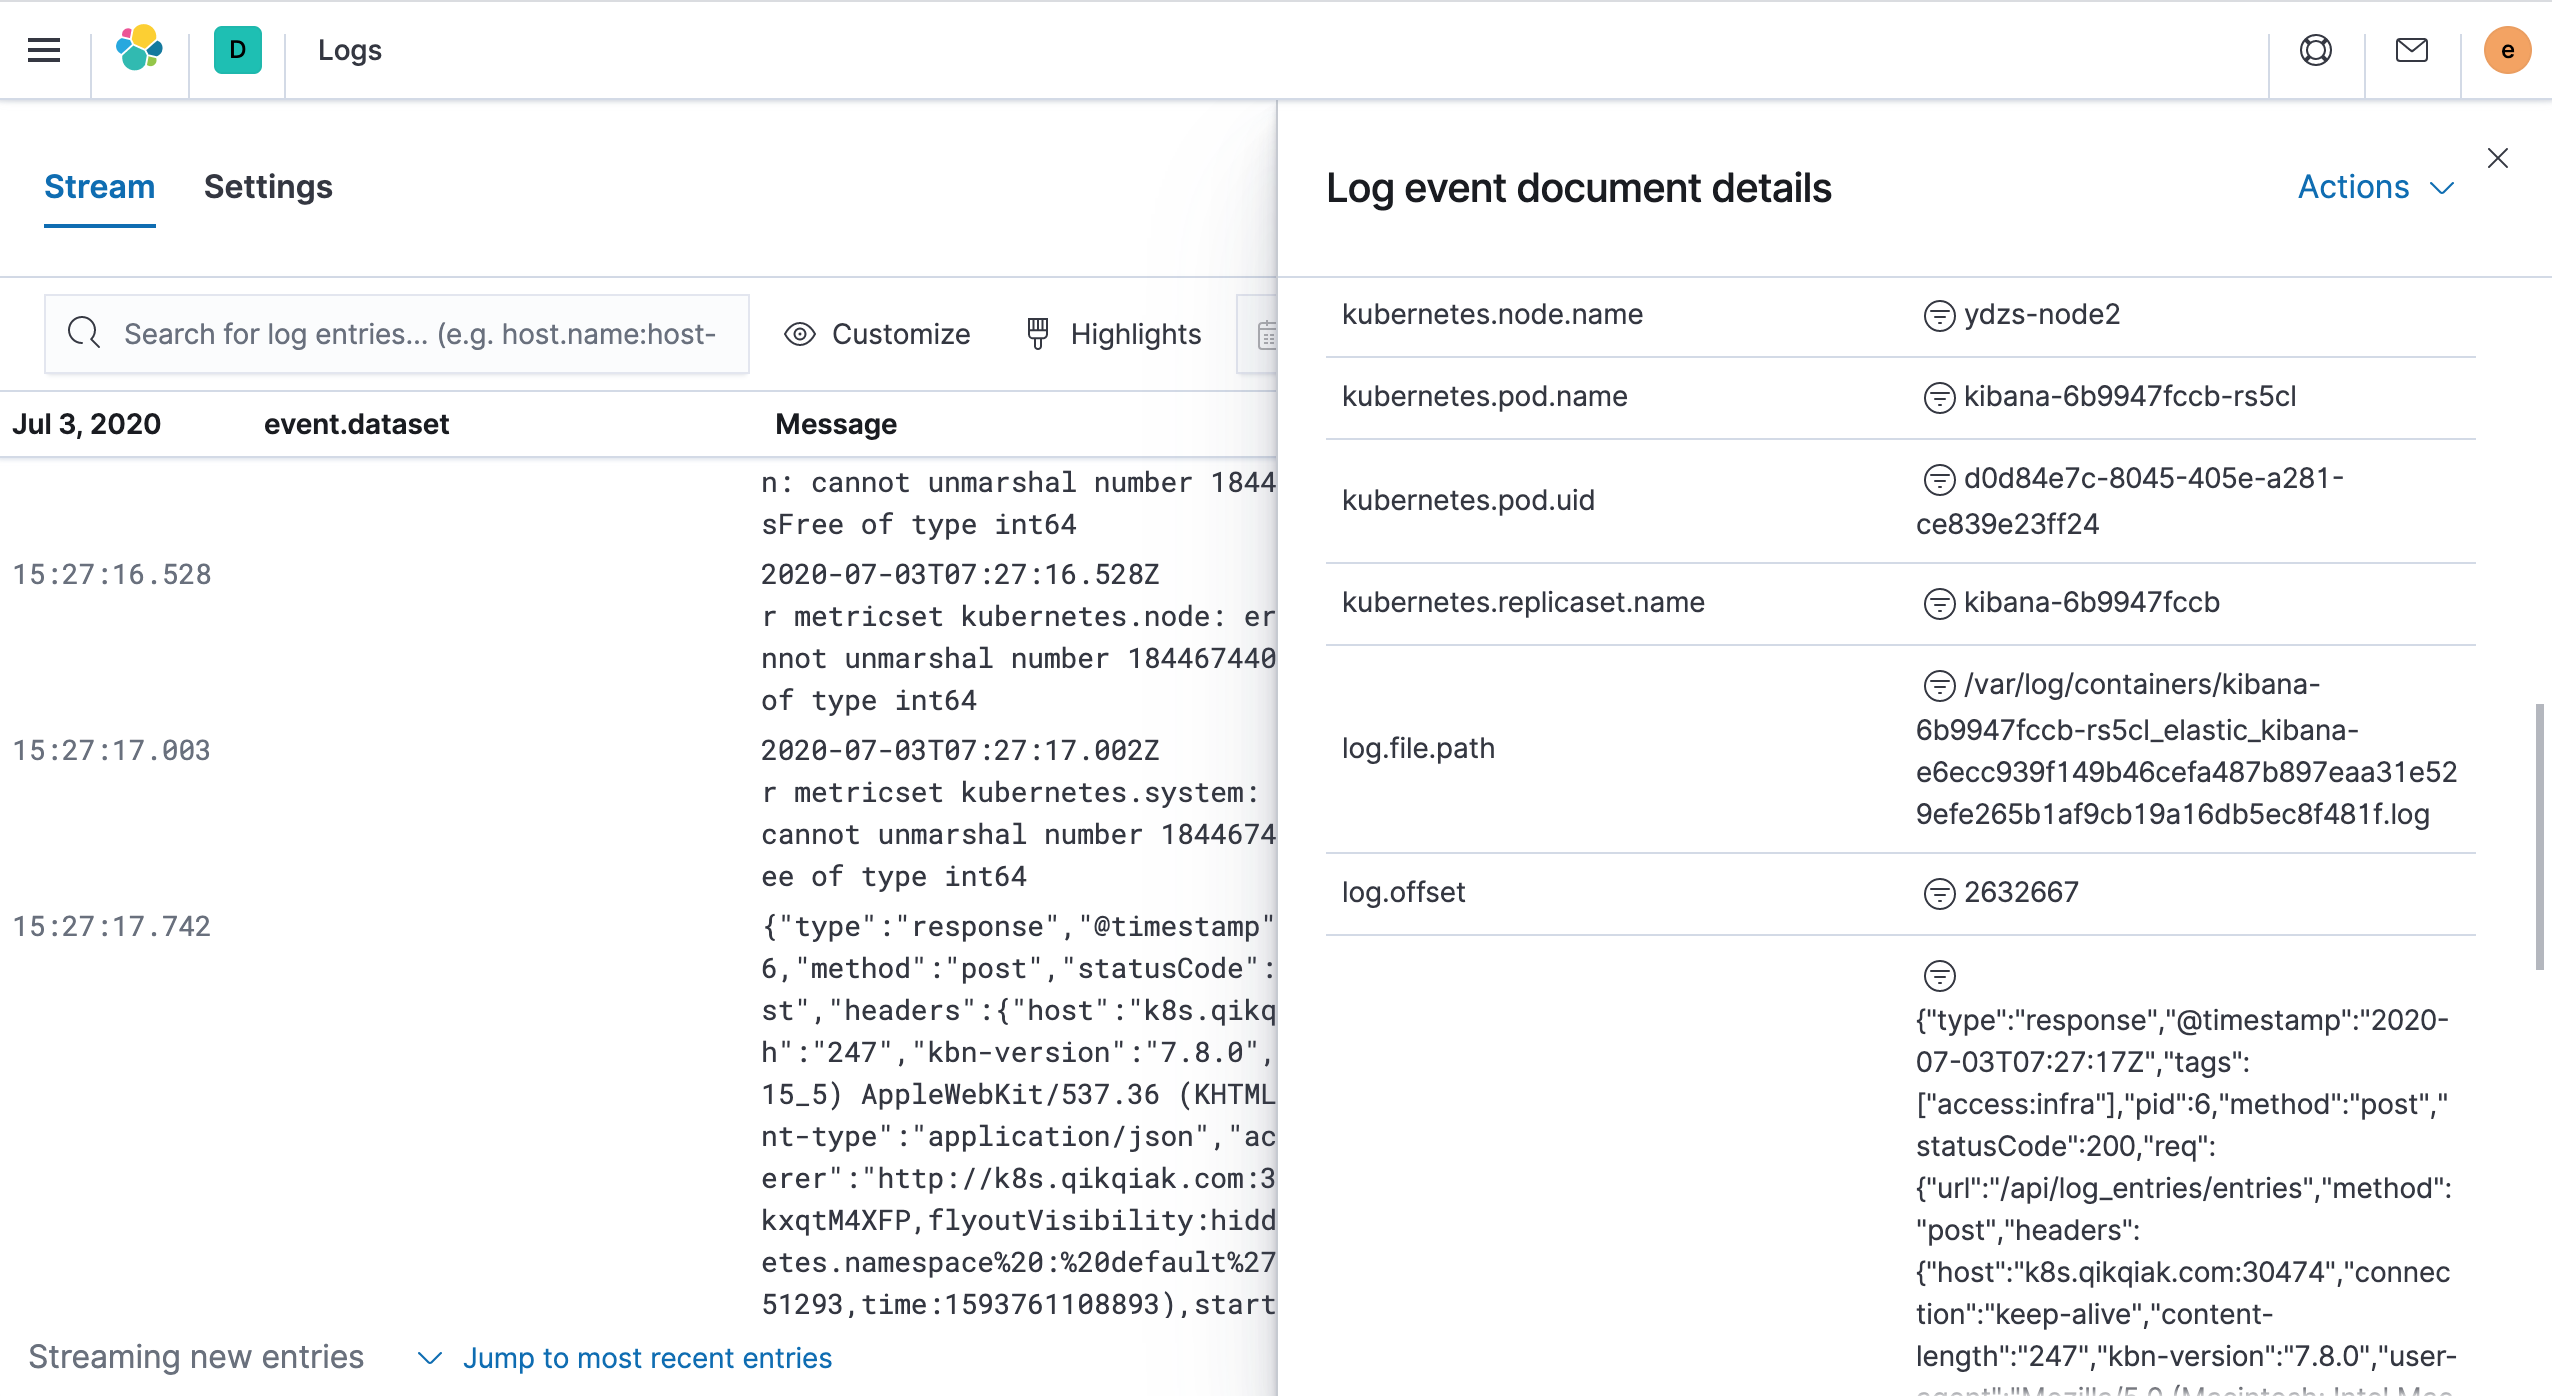
Once all the Pods of Filebeat and Logstash are in the Running state, the deployment is complete. Now we can go to the Kibana page to view the logs. Left menu Observability → Logs
You can also view the Pod’s logs by going to the Metrics page we mentioned in the previous section.
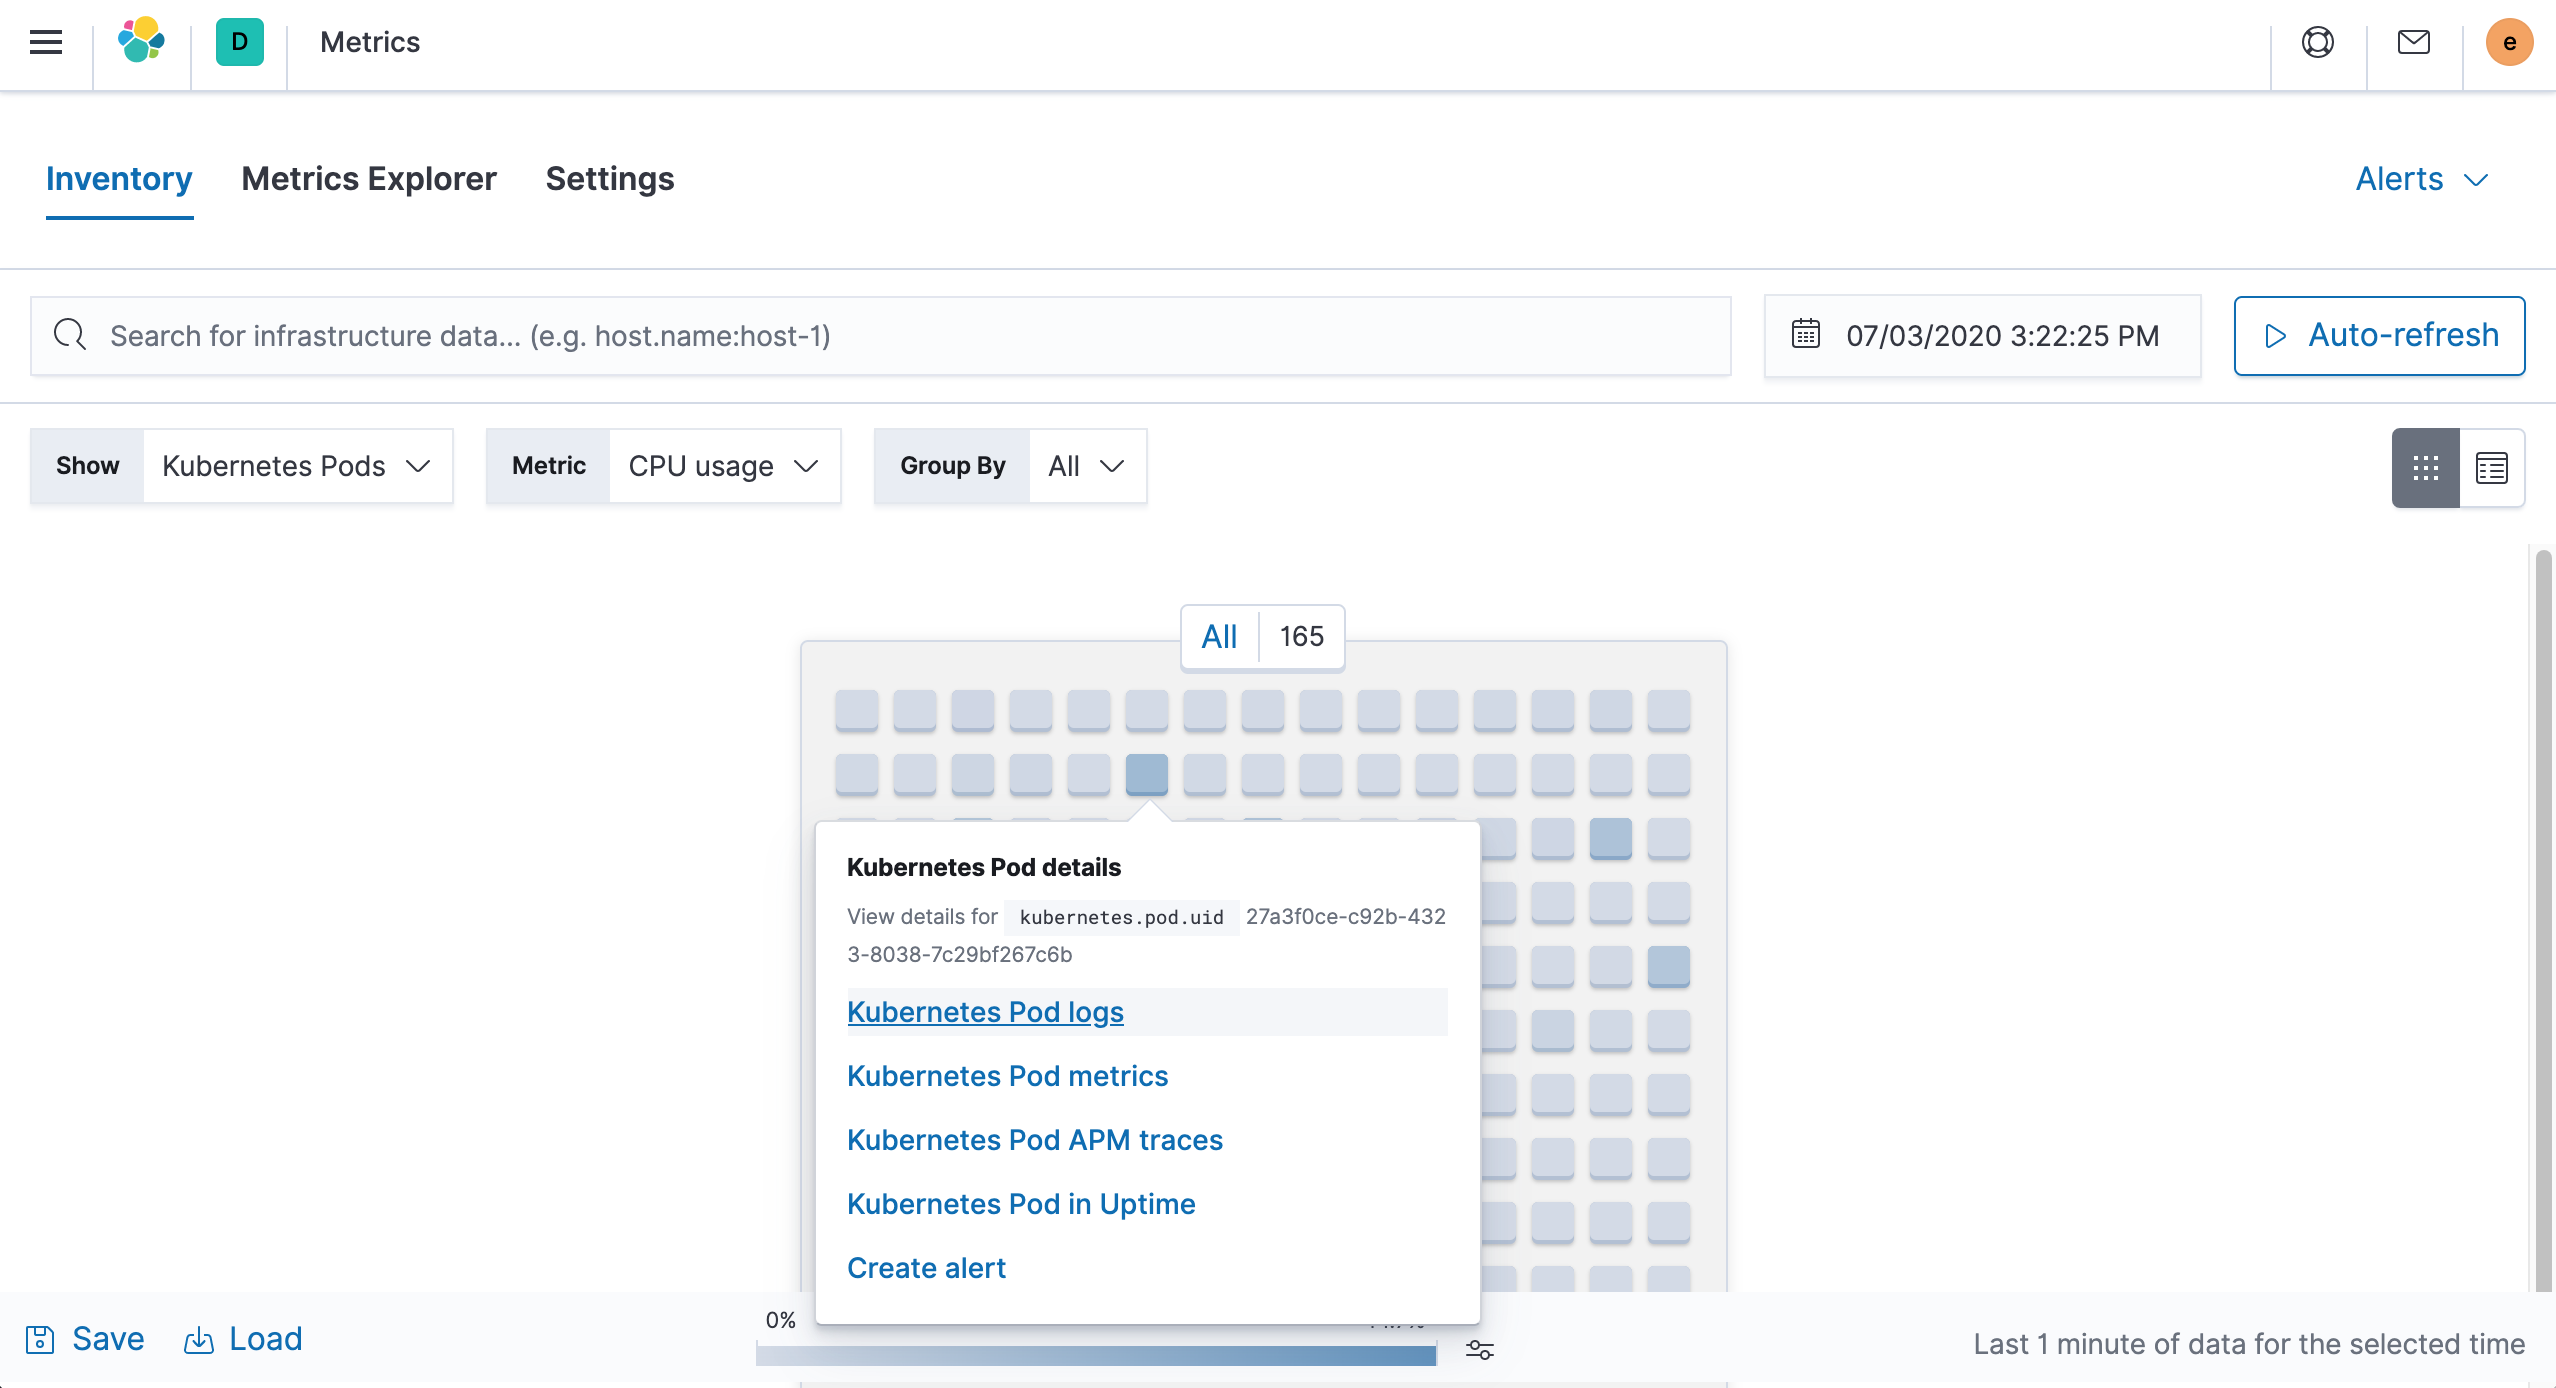
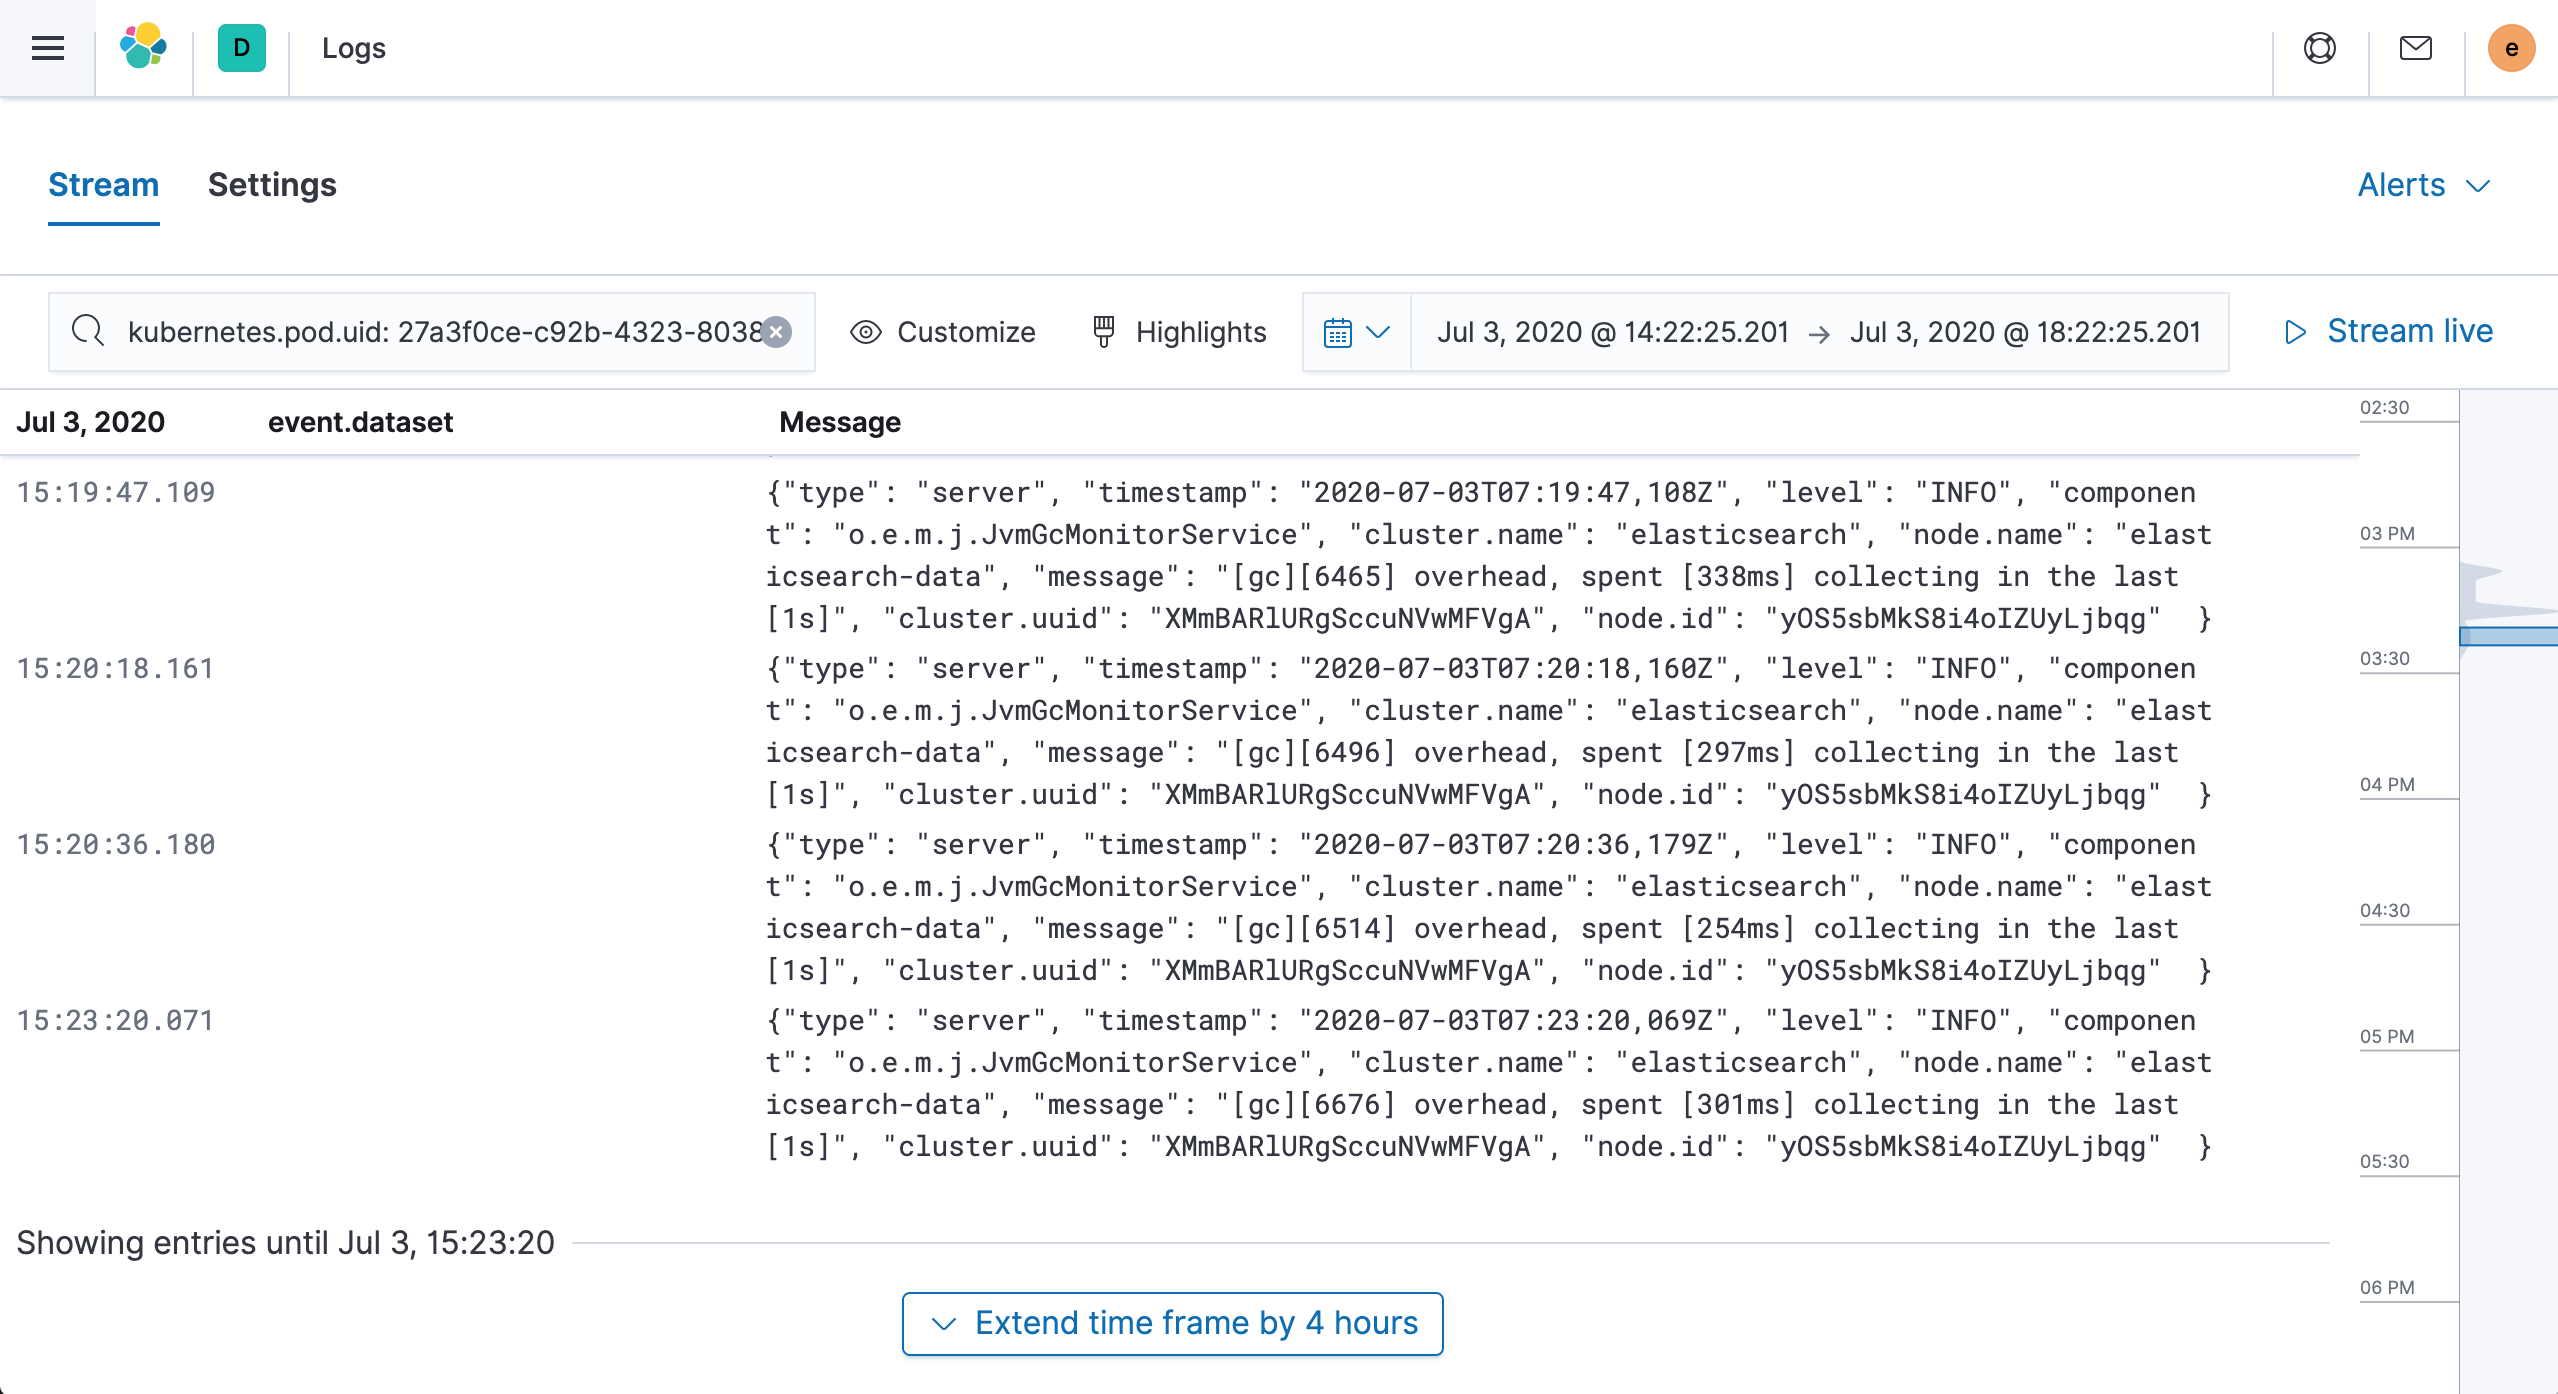
Click on Kubernetes Pod logs to get the Pod logs you need to see.
If the amount of log data to be collected in the cluster is too large, sending the data directly to ElasticSearch will put a lot of pressure on ES, so you can generally add a middleware like Kafka to buffer it, or collect Filebeat logs via Logstash.
Here we finish collecting Kubernetes cluster logs using Filebeat, and in the next article, we continue to learn how to use Elastic APM to track Kubernetes cluster applications.