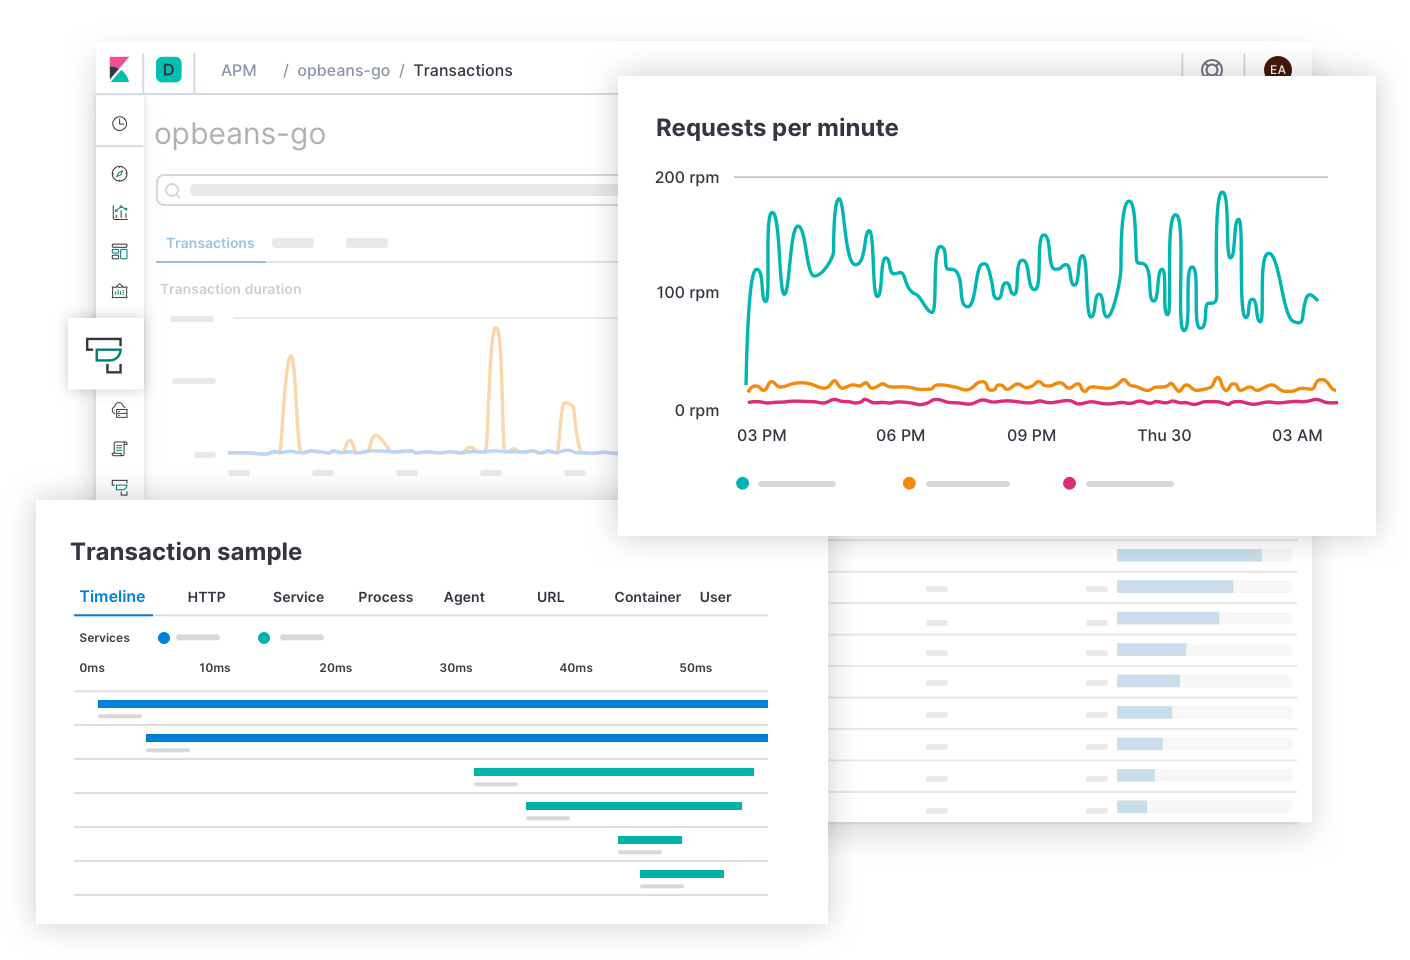
Elastic APM is a tool for application performance monitoring on Elastic Stack that allows us to monitor application performance in real time by collecting incoming requests, database queries, cache calls, and more. This makes it easier for us to quickly pinpoint performance issues.
Elastic APM is OpenTracing compatible, so we can use a large number of existing libraries to track application performance.
For example, we can trace a request in a distributed environment (microservice architecture) and easily find possible potential performance bottlenecks.
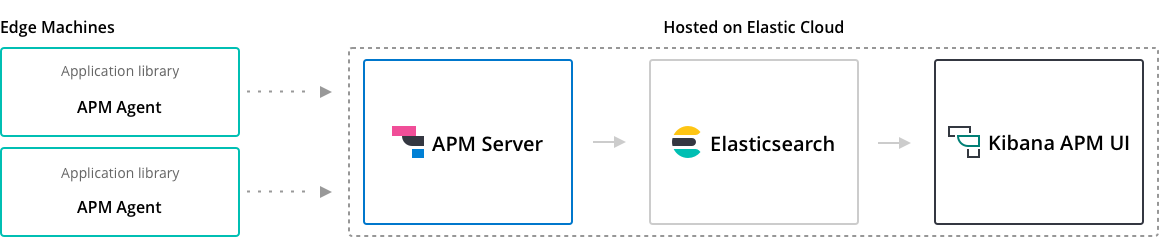
Elastic APM is served through a component called APM-Server, which collects and sends tracking data to ElasticSearch and the agent programs that run with the application.
Installing APM-Server
First we need to install the APM-Server on the Kubernetes cluster to collect the agent’s trace data and forward it to ElasticSearch, here again we use a ConfigMap to configure.
 1
 2
 3
 4
 5
 6
 7
 8
 9
10
11
12
13
14
15
16
17
18
19
20
21
22
|
# apm.configmap.yml
---
apiVersion: v1
kind: ConfigMap
metadata:
  namespace: elastic
  name: apm-server-config
  labels:
    app: apm-server
data:
  apm-server.yml: |-
    apm-server:
      host: "0.0.0.0:8200"

    output.elasticsearch:
      hosts: ['${ELASTICSEARCH_HOST:elasticsearch}:${ELASTICSEARCH_PORT:9200}']
      username: ${ELASTICSEARCH_USERNAME}
      password: ${ELASTICSEARCH_PASSWORD}

    setup.kibana:
      host: '${KIBANA_HOST:kibana}:${KIBANA_PORT:5601}'
---
|
The APM-Server needs to expose port 8200 for the agent to forward their trace data, and a new corresponding Service object can be created.
 1
 2
 3
 4
 5
 6
 7
 8
 9
10
11
12
13
14
15
16
|
# apm.service.yml
---
apiVersion: v1
kind: Service
metadata:
  namespace: elastic
  name: apm-server
  labels:
    app: apm-server
spec:
  ports:
  - port: 8200
    name: apm-server
  selector:
    app: apm-server
---
|
This is then managed using a Deployment resource object.
 1
 2
 3
 4
 5
 6
 7
 8
 9
10
11
12
13
14
15
16
17
18
19
20
21
22
23
24
25
26
27
28
29
30
31
32
33
34
35
36
37
38
39
40
41
42
43
44
45
46
47
48
49
50
51
|
# apm.deployment.yml
---
apiVersion: apps/v1
kind: Deployment
metadata:
  namespace: elastic
  name: apm-server
  labels:
    app: apm-server
spec:
  replicas: 1
  selector:
    matchLabels:
      app: apm-server
  template:
    metadata:
      labels:
        app: apm-server
    spec:
      containers:
      - name: apm-server
        image: docker.elastic.co/apm/apm-server:7.8.0
        env:
        - name: ELASTICSEARCH_HOST
          value: elasticsearch-client.elastic.svc.cluster.local
        - name: ELASTICSEARCH_PORT
          value: "9200"
        - name: ELASTICSEARCH_USERNAME
          value: elastic
        - name: ELASTICSEARCH_PASSWORD
          valueFrom:
            secretKeyRef:
              name: elasticsearch-pw-elastic
              key: password
        - name: KIBANA_HOST
          value: kibana.elastic.svc.cluster.local
        - name: KIBANA_PORT
          value: "5601"
        ports:
        - containerPort: 8200
          name: apm-server
        volumeMounts:
        - name: config
          mountPath: /usr/share/apm-server/apm-server.yml
          readOnly: true
          subPath: apm-server.yml
      volumes:
      - name: config
        configMap:
          name: apm-server-config
---
|
Deploy several of the above resource objects directly.
1
2
3
4
5
6
7
|
$ kubectl apply  -f apm.deployment.yml \
                 -f apm.service.yml \
                 -f apm.deployment.yml

configmap/apm-server-config created
service/apm-server created
deployment.extensions/apm-server created
|
When the Pod is in the Running state, it proves to be running successfully.
1
2
3
|
$ kubectl get pods -n elastic -l app=apm-server
NAME                          READY   STATUS    RESTARTS   AGE
apm-server-667bfc5cff-zj8nq   1/1     Running   0          12m
|
Next we can install an agent application on top of the Spring-Boot application deployed in the first section.
Configuring the Java Agent
Next we configure an Elastic APM Java agent on the sample application spring-boot-simple.
First we need to build elastic-apm-agent-1.8.0.jar jar package into the application container, and add the following line to the Dockerfile file of the build image to download the JAR package directly.
1
|
RUN wget -O /apm-agent.jar https://search.maven.org/remotecontent?filepath=co/elastic/apm/elastic-apm-agent/1.8.0/elastic-apm-agent-1.8.0.jar
|
The complete Dockerfile file is shown below.
1
2
3
4
5
6
7
8
|
FROM openjdk:8-jdk-alpine

ENV ELASTIC_APM_VERSION "1.8.0"
RUN wget -O /apm-agent.jar https://search.maven.org/remotecontent?filepath=co/elastic/apm/elastic-apm-agent/$ELASTIC_APM_VERSION/elastic-apm-agent-$ELASTIC_APM_VERSION.jar

COPY target/spring-boot-simple.jar /app.jar

CMD java -jar /app.jar
|
Then we need to add the following dependencies to the sample application so that we can integrate open-tracing’s dependency library or use the Elastic APM API Manual detection.
 1
 2
 3
 4
 5
 6
 7
 8
 9
10
11
12
13
14
15
|
<dependency>
    <groupId>co.elastic.apm</groupId>
    <artifactId>apm-agent-api</artifactId>
    <version>${elastic-apm.version}</version>
</dependency>
<dependency>
    <groupId>co.elastic.apm</groupId>
    <artifactId>apm-opentracing</artifactId>
    <version>${elastic-apm.version}</version>
</dependency>
<dependency>
    <groupId>io.opentracing.contrib</groupId>
    <artifactId>opentracing-spring-cloud-mongo-starter</artifactId>
    <version>${opentracing-spring-cloud.version}</version>
</dependency>
|
Then you need to modify the Spring-Boot application deployed using Deployment in the first article, you need to enable the Java agent and connect to the APM-Server.
 1
 2
 3
 4
 5
 6
 7
 8
 9
10
11
12
13
14
15
16
17
18
19
20
21
22
23
24
25
26
27
28
29
30
31
32
33
34
35
36
37
38
39
40
|
# spring-boot-simple.deployment.yml
---
apiVersion: apps/v1
kind: Deployment
metadata:
  namespace: elastic
  name: spring-boot-simple
  labels:
    app: spring-boot-simple
spec:
  selector:
    matchLabels:
      app: spring-boot-simple
  template:
    metadata:
      labels:
        app: spring-boot-simple
    spec:
      containers:
      - image: cnych/spring-boot-simple:0.0.1-SNAPSHOT
        imagePullPolicy: Always
        name: spring-boot-simple
        command:
          - "java"
          - "-javaagent:/apm-agent.jar"
          - "-Delastic.apm.active=$(ELASTIC_APM_ACTIVE)"
          - "-Delastic.apm.server_urls=$(ELASTIC_APM_SERVER)"
          - "-Delastic.apm.service_name=spring-boot-simple"
          - "-jar"
          - "app.jar"
        env:
          - name: SPRING_DATA_MONGODB_HOST
            value: mongo
          - name: ELASTIC_APM_ACTIVE
            value: "true"
          - name: ELASTIC_APM_SERVER
            value: http://apm-server.elastic.svc.cluster.local:8200
        ports:
        - containerPort: 8080
---
|
Then redeploy the sample application above.
1
2
3
4
5
6
7
|
$ kubectl apply -f spring-boot-simple.yml
$ kubectl get pods -n elastic -l app=spring-boot-simple
NAME                                 READY   STATUS    RESTARTS   AGE
spring-boot-simple-fb5564885-tf68d   1/1     Running   0          5m11s
$ kubectl get svc -n elastic -l app=spring-boot-simple
NAME                 TYPE       CLUSTER-IP      EXTERNAL-IP   PORT(S)          AGE
spring-boot-simple   NodePort   10.109.55.134   <none>        8080:31847/TCP   9d
|
When the sample application is redeployed, several requests are executed as follows.
get messages
Gets the data of all published messages.
1
|
$ curl -X GET http://k8s.qikqiak.com:31847/message
|
get messages (slow requests)
Use sleep=<ms> to simulate a slow request.
1
|
$ curl -X GET http://k8s.qikqiak.com:31847/message?sleep=3000
|
get messages (error)
Use error=true to trigger an exception.
1
|
$ curl -X GET http://k8s.qikqiak.com:31847/message?error=true
|
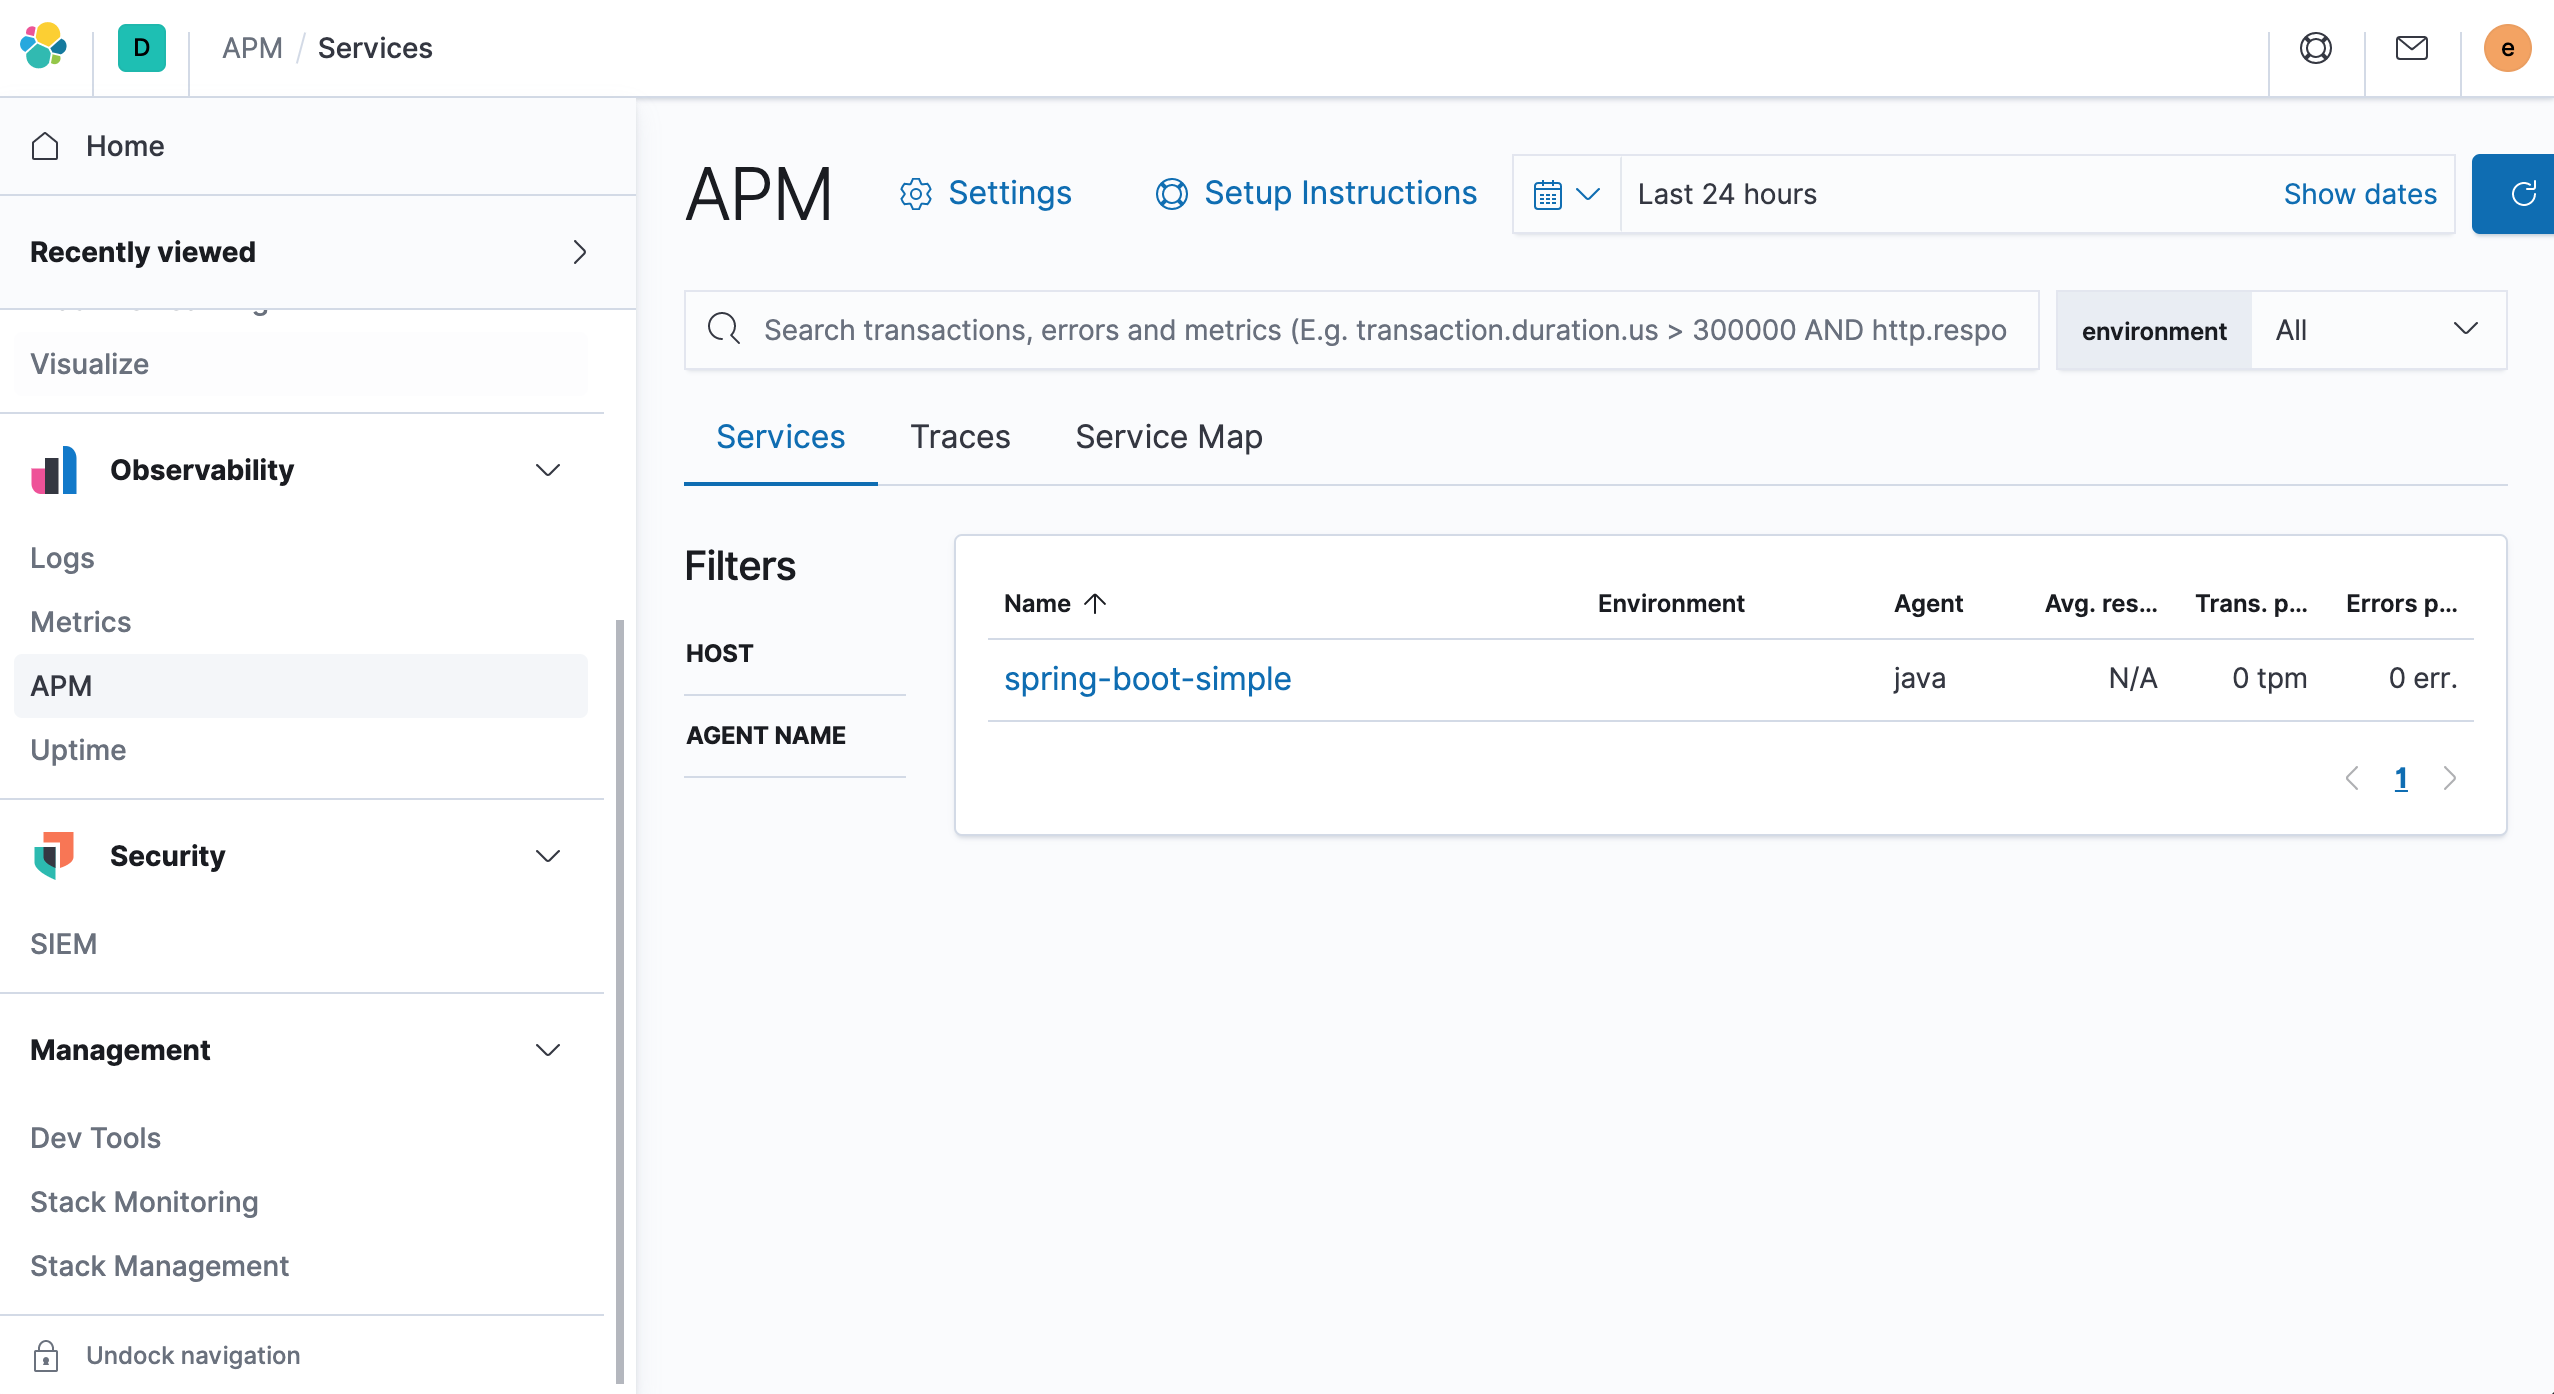
Now let’s go to the Kibana page and route to the APM page and we should see the data for the spring-boot-simple application.
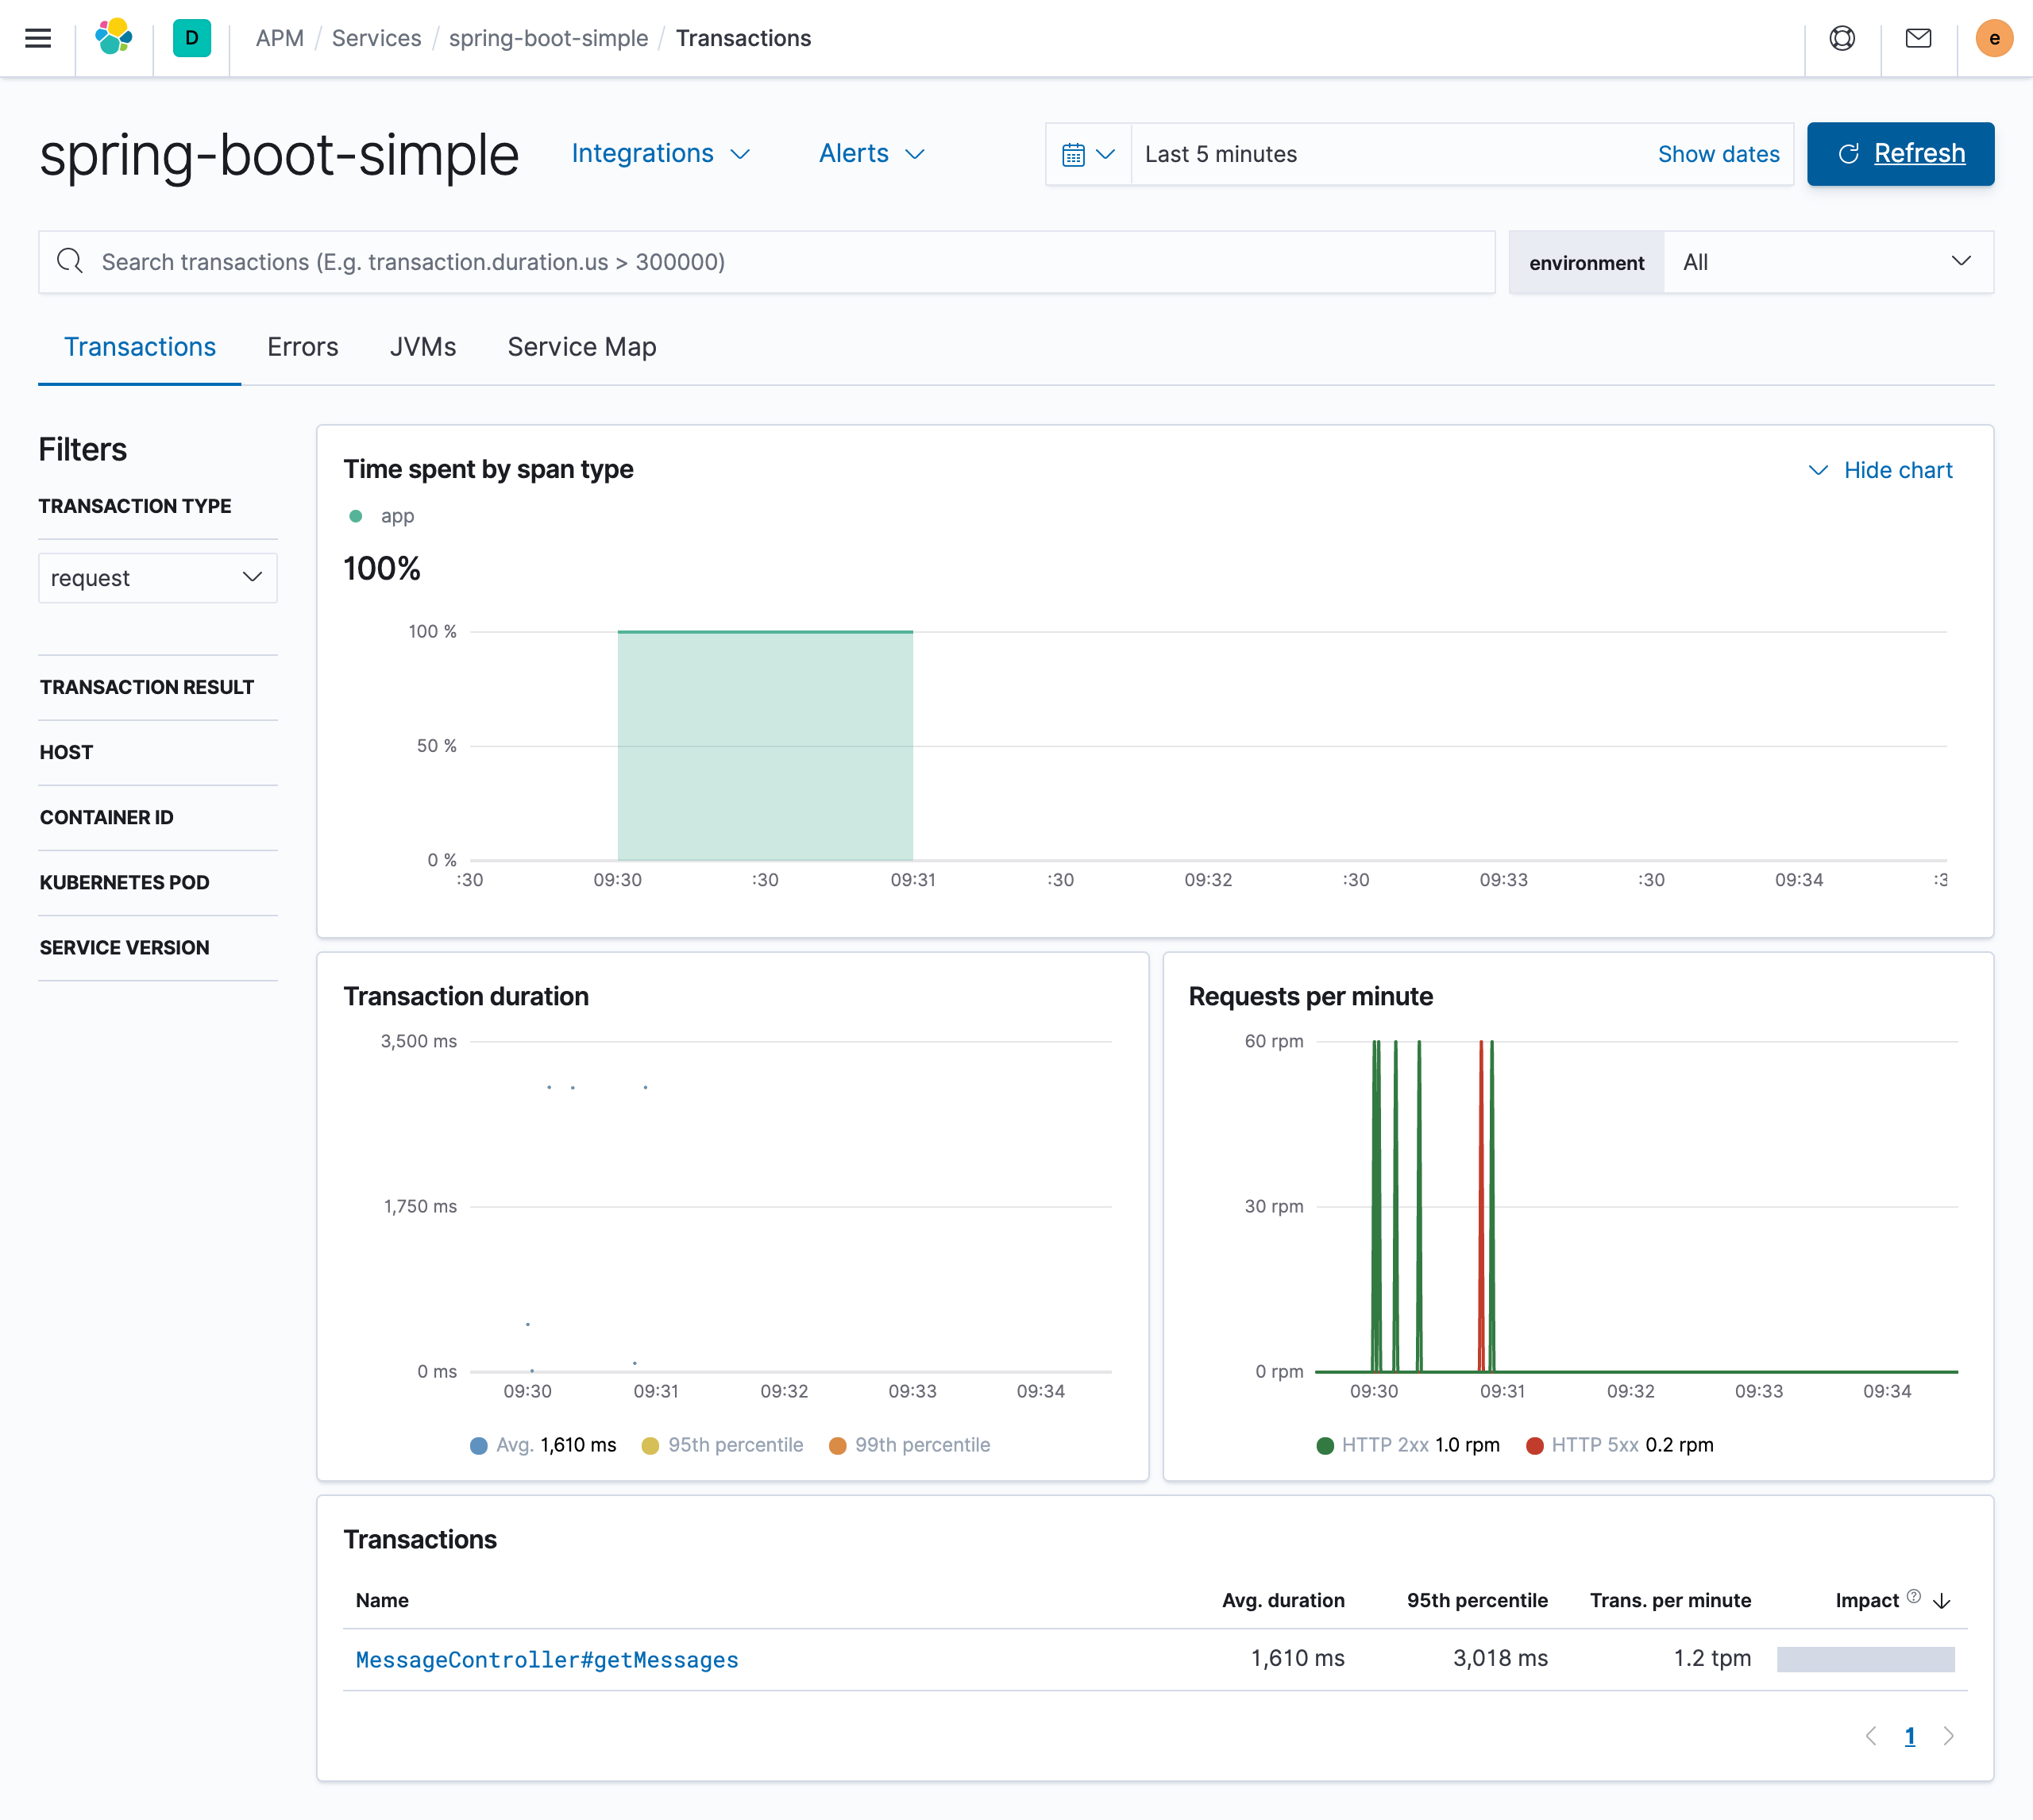
Various performance tracking data for the current application can be viewed by clicking on the application.
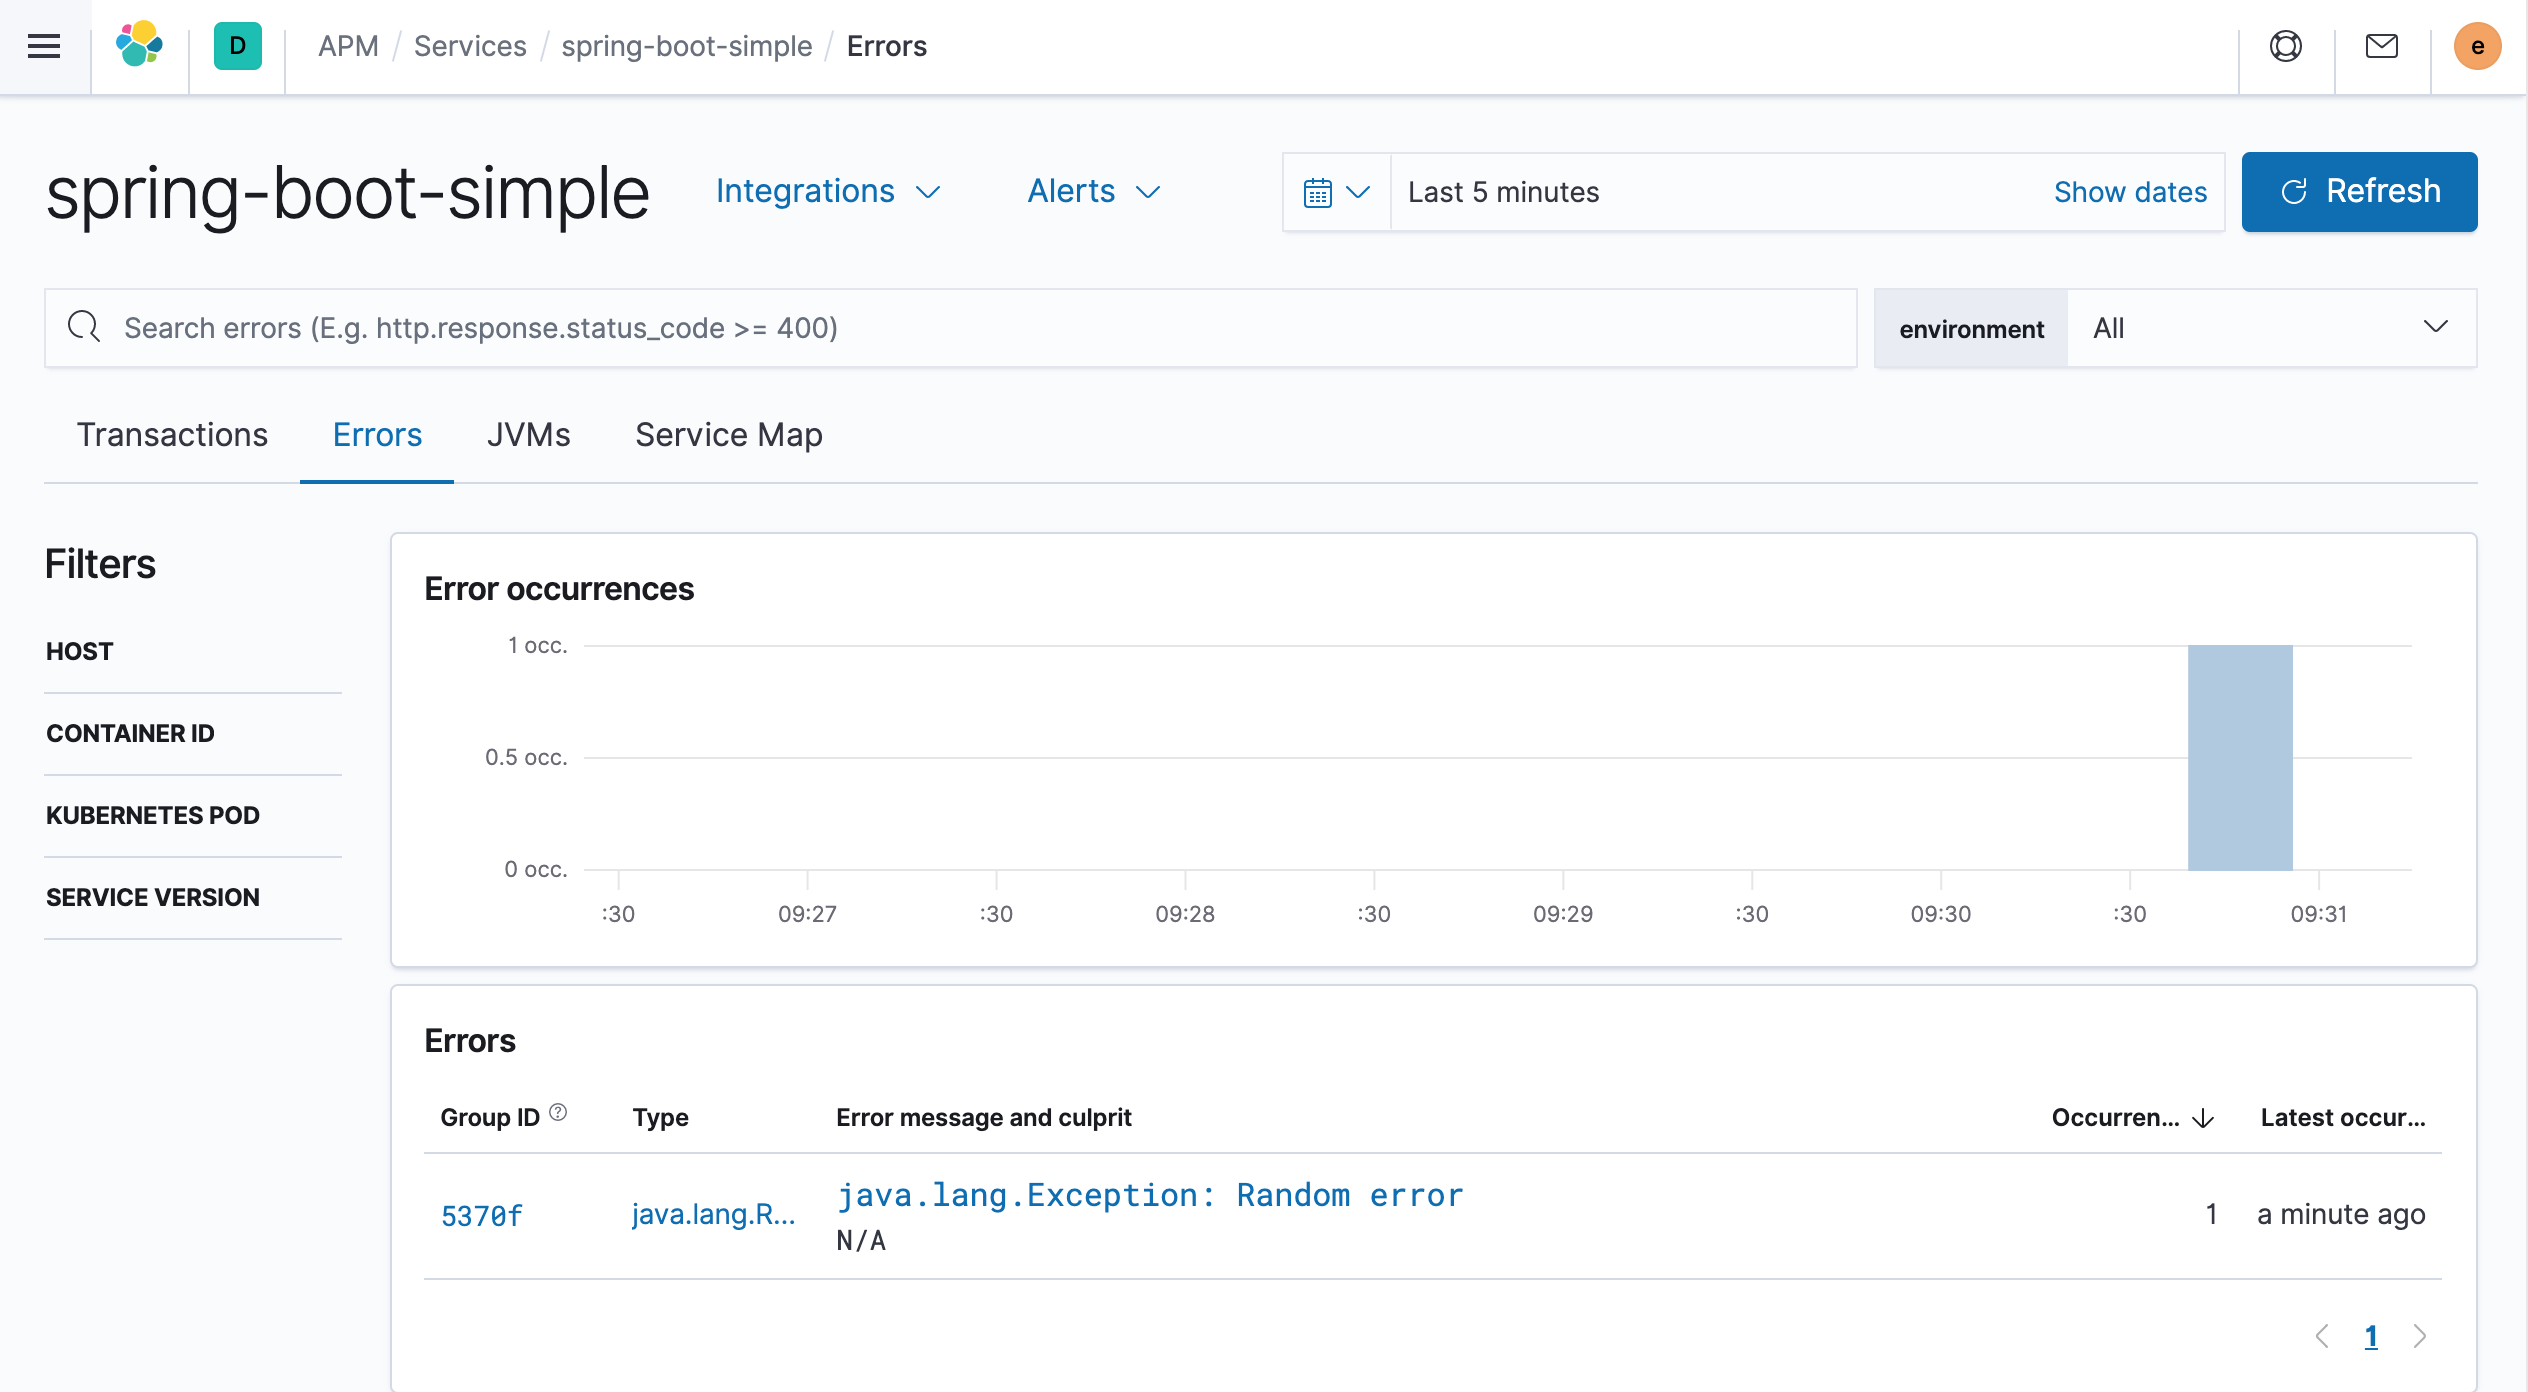
The current error data can be viewed at
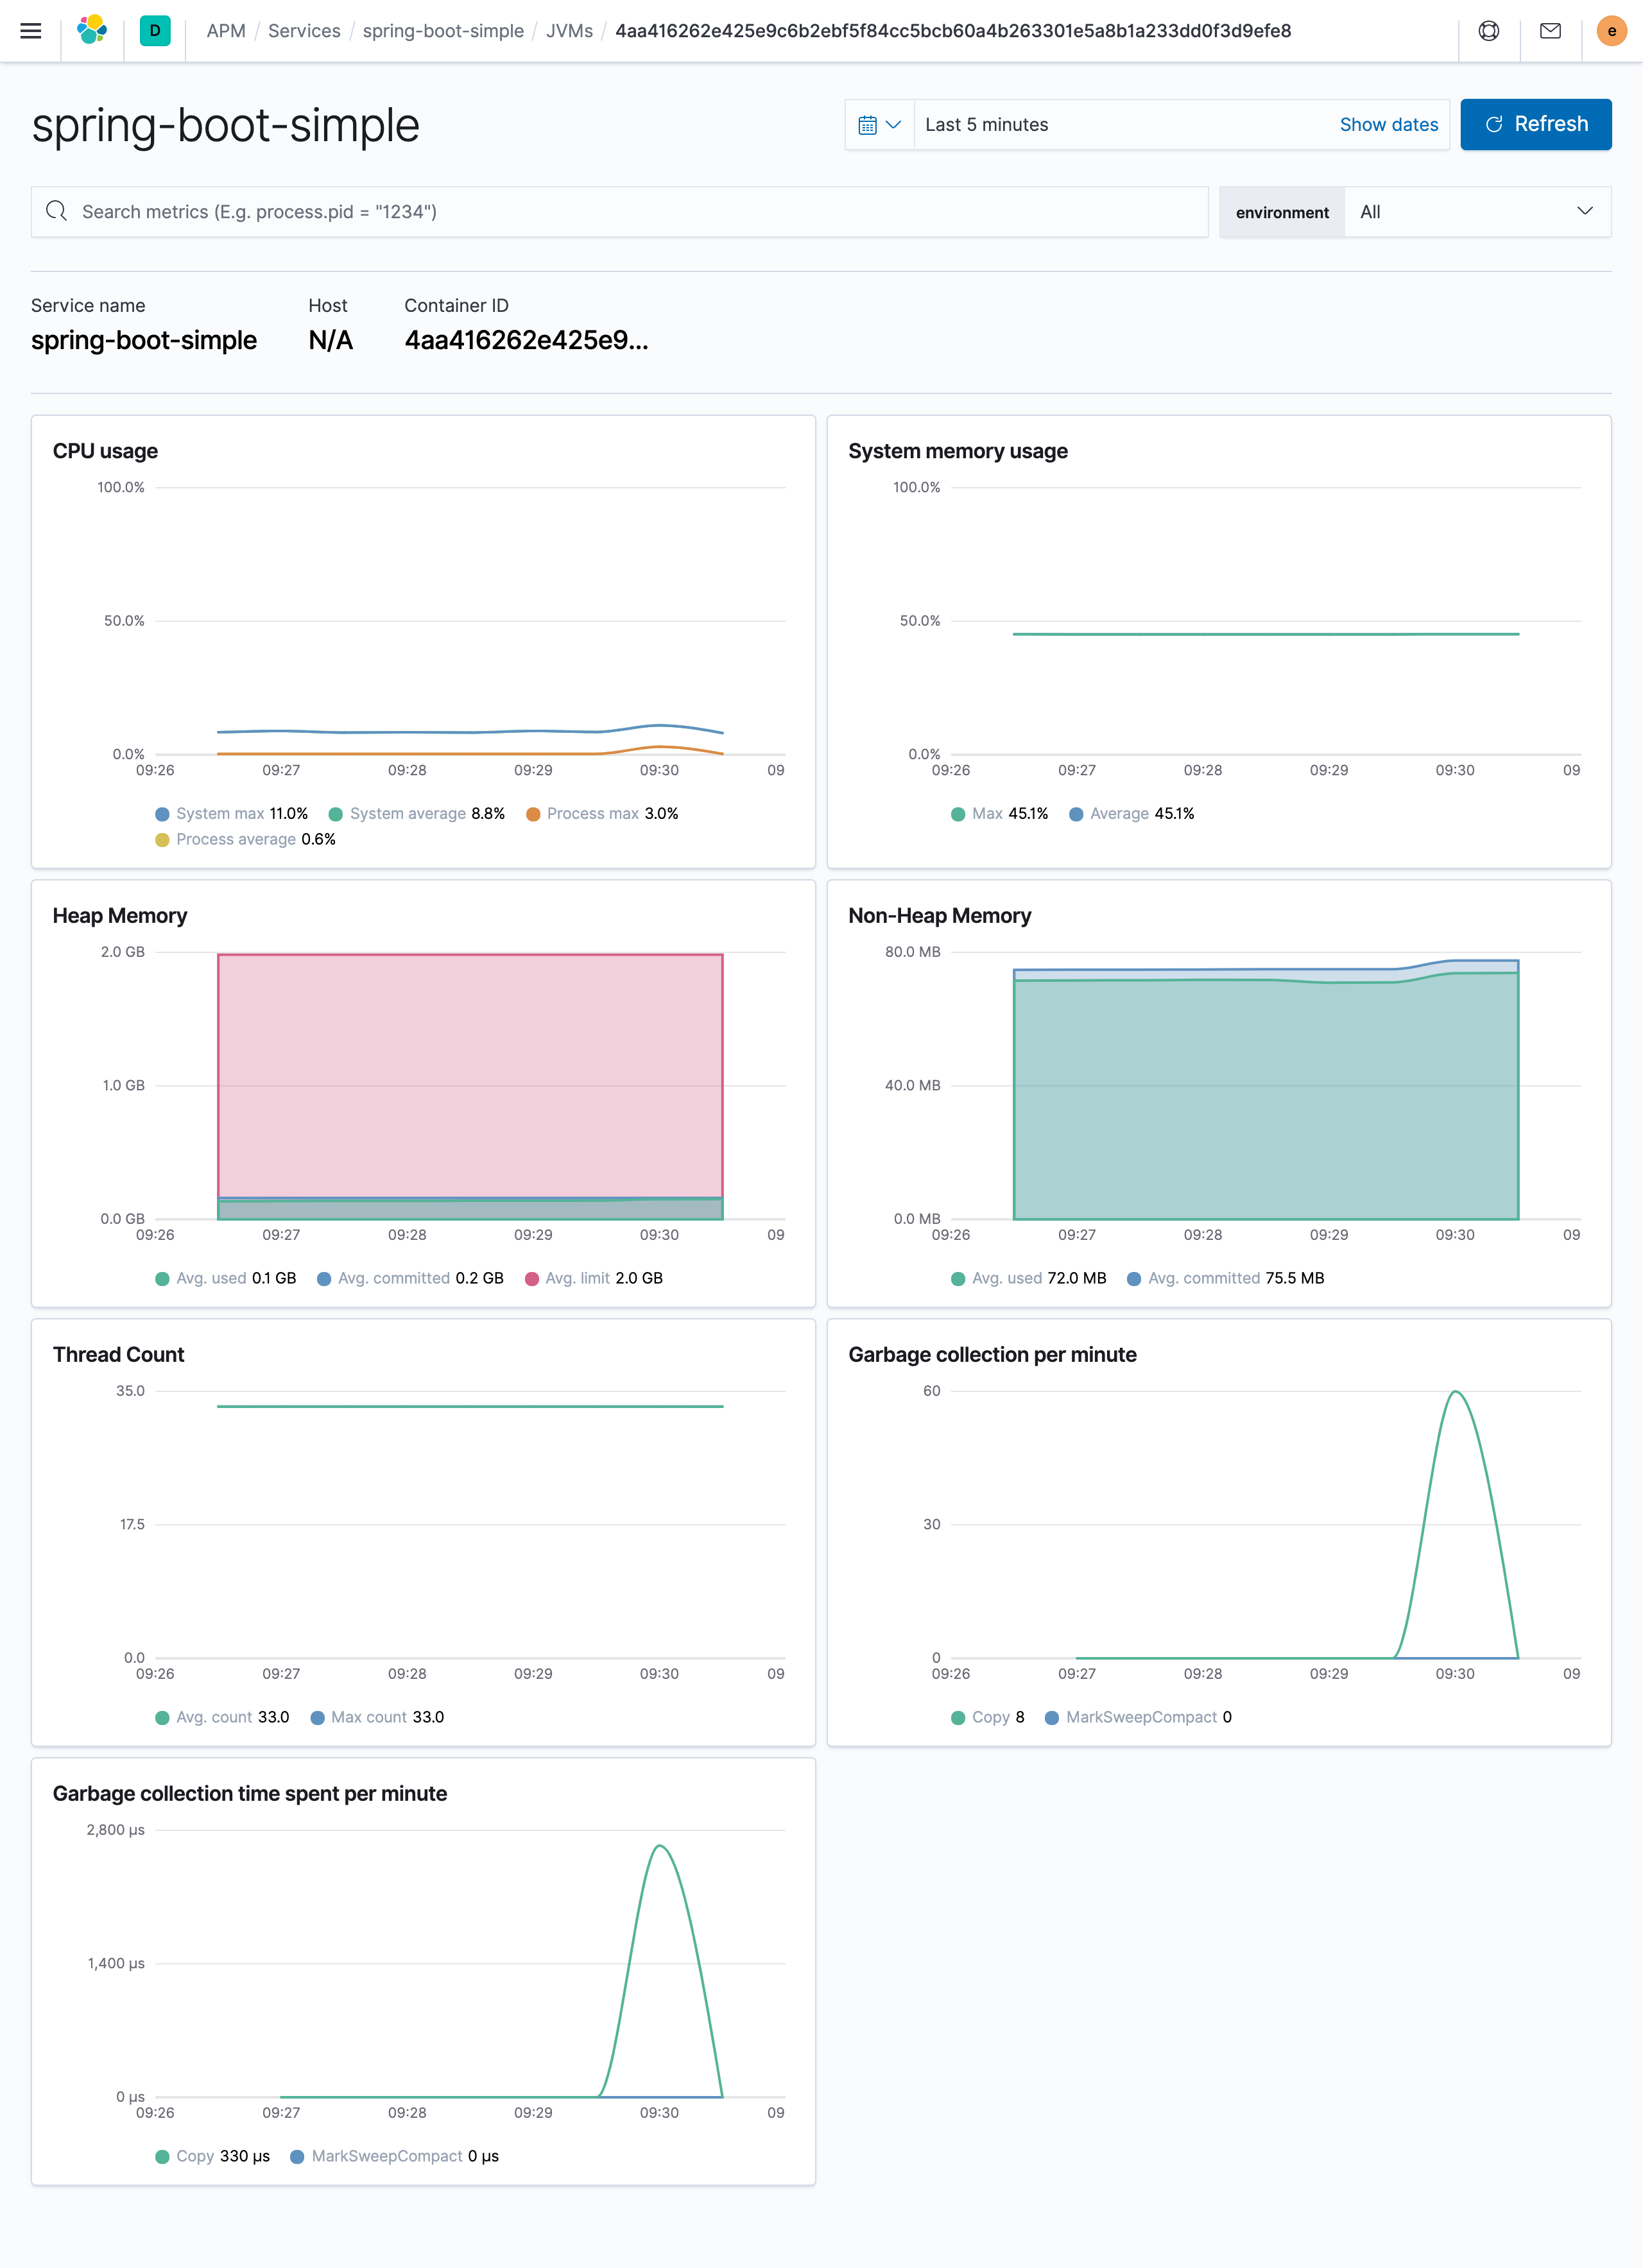
You can also view JVM monitoring data at
In addition, we can also add alarm information, so we can keep track of the performance status of the application at the first time.
Summary
This concludes our full-stack monitoring of our Kubernetes environment using Elastic Stack, which allows us to understand all aspects of our application’s performance through monitoring metrics, logs, and performance tracking, and speeds up our troubleshooting and problem solving.