1. Aggregate data using Query
Thanos Query can interface not only with Thanos Store Gateway, but also with any component that is compatible with Prometheus API. Here is the diagram.
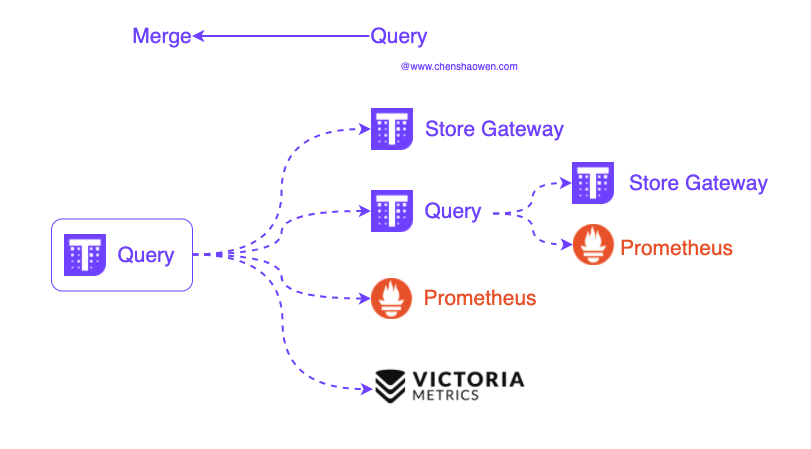
Thanos Query can be interfaced with the following components.
- Thanos Store Gateway
- Thanos Query
- Prometheus
- VictoriaMetrics
- Prometheus API-compatible components
Using the cascading between Thanos Query, we can implement correlated queries across components to build mega-monitoring systems. This also means that each docked component should provide a fast enough Prometheus API. the response time of the whole interface depends on the response time of the slowest component.
Of course, you can also provide different levels of query data sources at different levels. The following diagram:
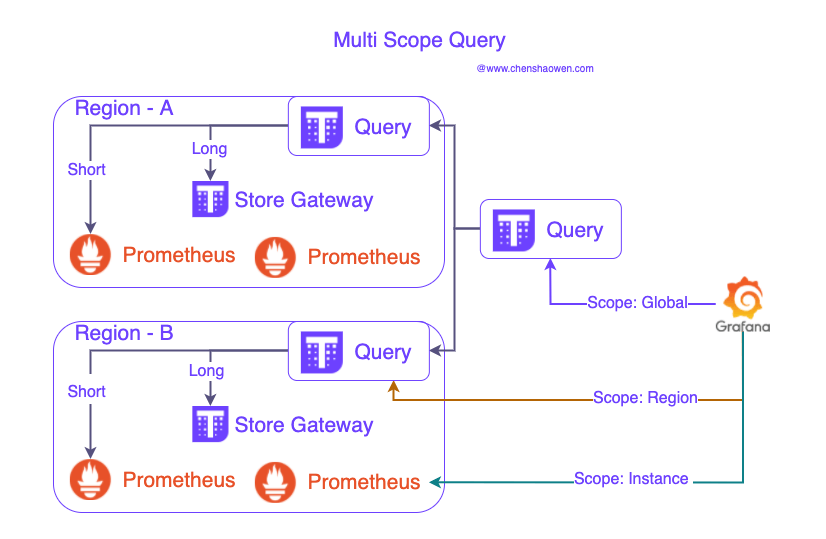
Query interfaces are available at the global, regional, and instance levels.
2. Metrics data splitting and lifecycle management
Thanos uses a storage space for compute memory and time approach to speed up queries for long-cycle metrics. The Thanos Compact component takes small blocks of storage and combines them into larger blocks to speed up queries. The Compact component provides the ability to manage blocks as shown in the figure below.
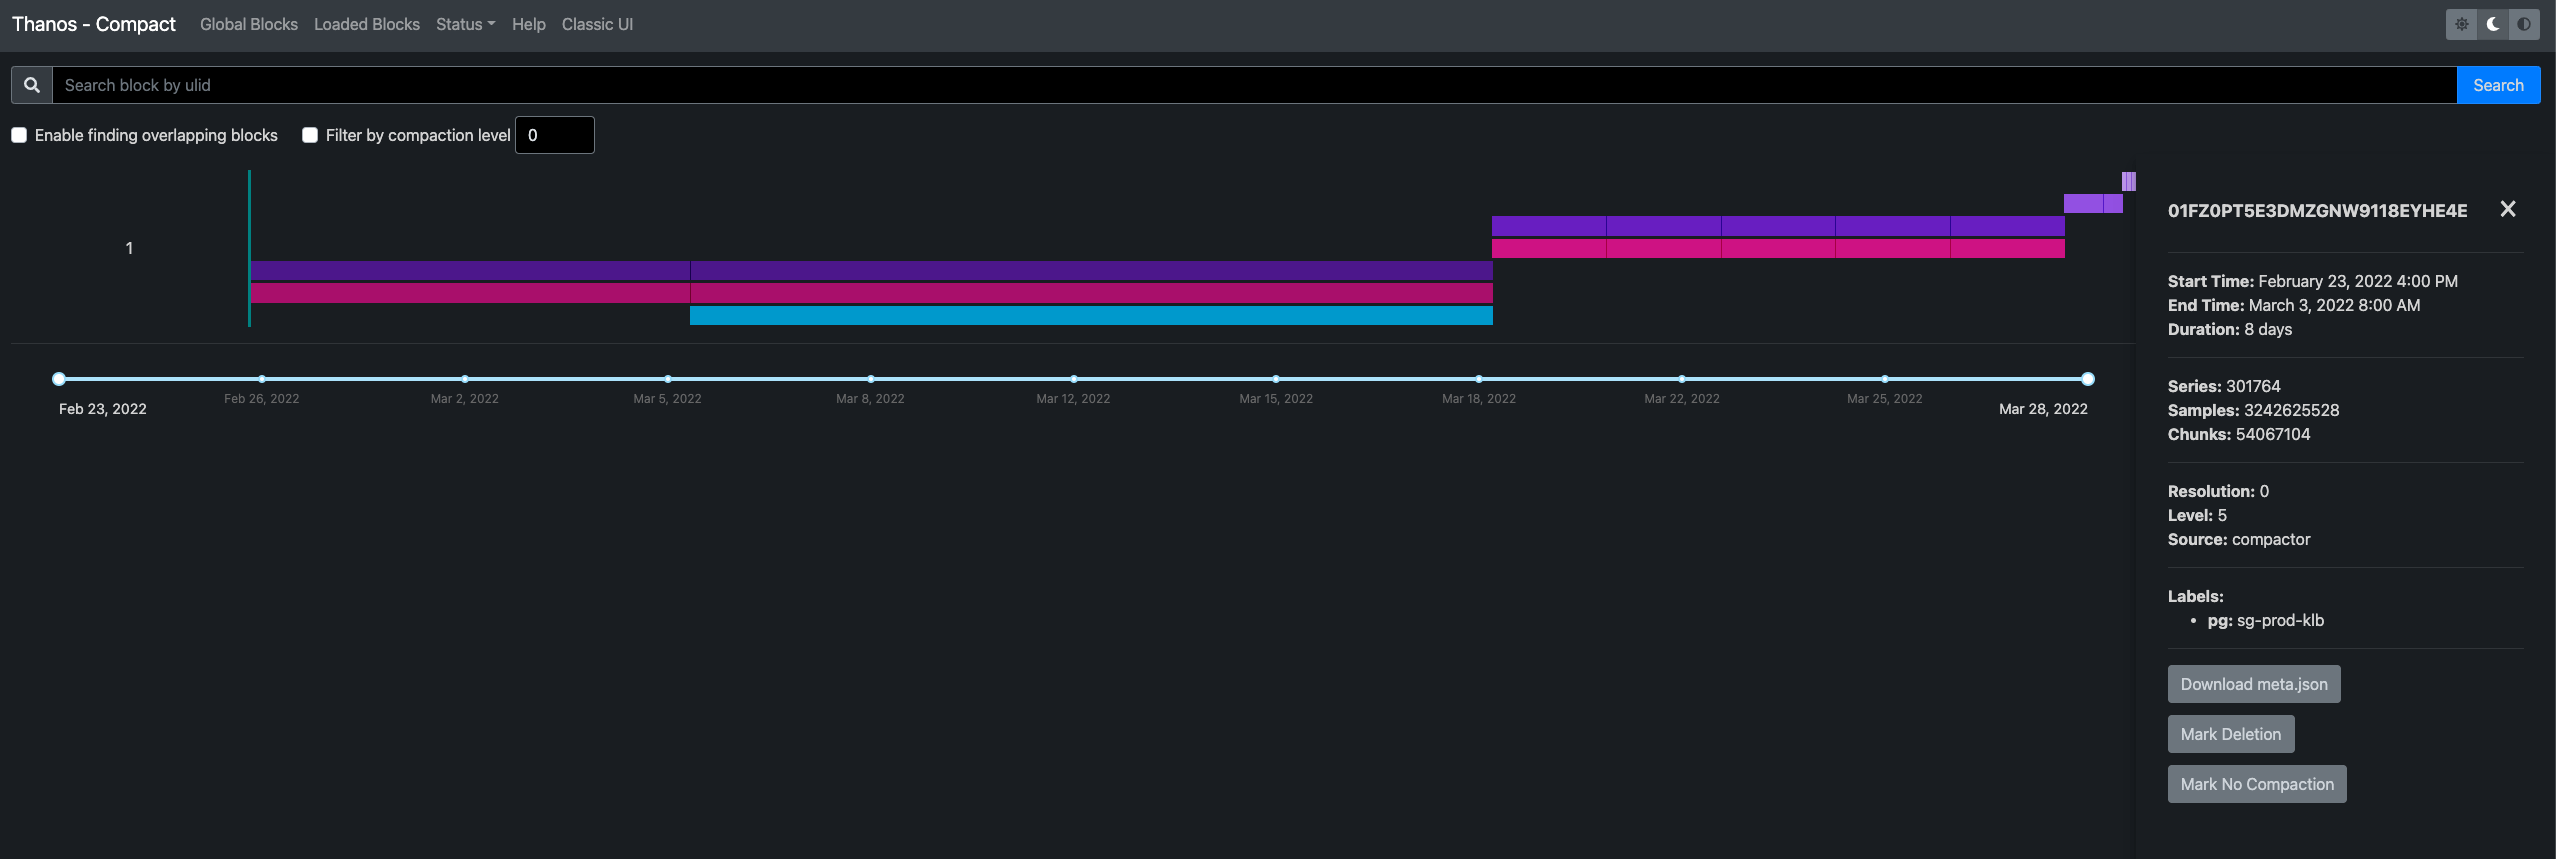
In the lower left corner, we can mark a block for deletion or choose not to downsample it.
When the downsampling switch is turned on, Compact will downsample all raw metrics stored longer than 40 h for 5 min and all 5-min metrics stored longer than 10 day for 1 h. As for how long the raw data, 5-min sampled metrics, and 1-h sampled metrics are stored, you can configure them with the following parameters:
-retention.resolution-raw=90d, the raw data is stored for the last 90 days--retention.resolution-5m=180d, where the 5-minute sample data is stored for 180 days--retention.resolution-1h=360d, 1 hour of sampled data is stored for 360 days, 0d means permanent storage
This means that we can only see the sequence of 1 h sampled throughout the year, but not any details of the data within 1 h six months ago; we can only see the sequence of 5 min sampled six months ago, but not any details of the data within 5 min three months ago.
To avoid conflicts, a Bucket is also allowed to run only one Compact, whose parameters directly determine the life cycle of a storage Bucket.
When the business is large, it is impossible to store all the monitoring data in just one Bucket, even if the performance of the object storage is already very good. We still need to split the data store, as shown below:
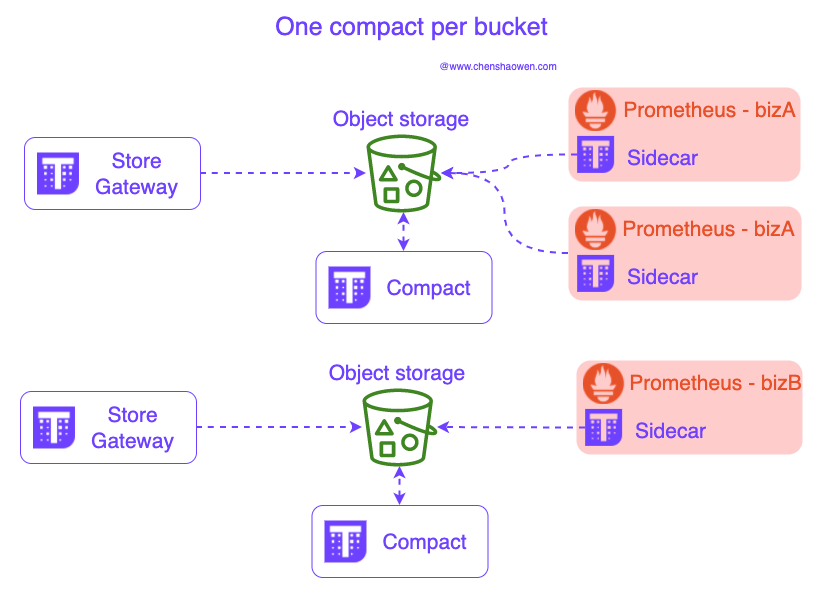
Each Store Gateway needs to be configured with a Bucket bucket, and a Bucket allows only one Compact. the Bucket can be divided according to the following dimensions:
- Settlement Team
- Region
- Affiliated Businesses
- Infrastructure Hierarchy
- Horizontal splitting of single metrics
3. Set the Prometheus storage period to 6h
When you first use Thanos, you will encounter two confusing points:
- How come there is no data for the last 2 h
Because there is no query source configured for Prometheus.
- How is the query speed not improved
Because Prometheus query sources have too long a storage period.
The answer is in the following figure:
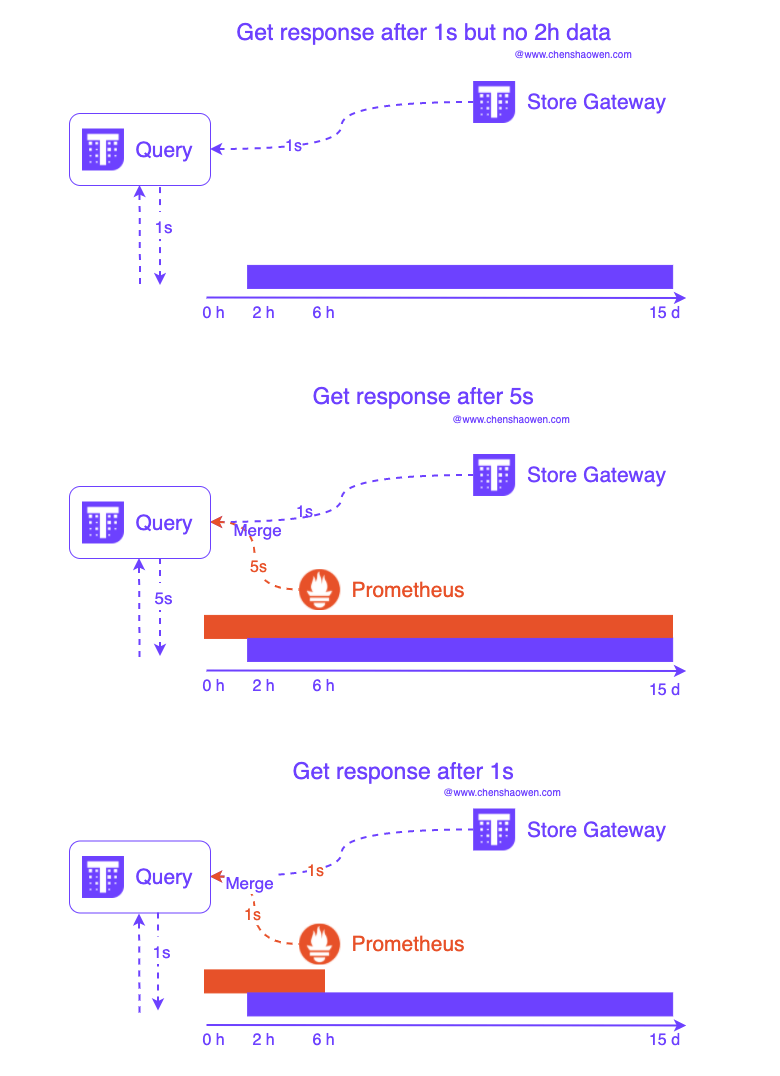
- Sidecar mode uploads data every 2 h, so if only the Store Gateway address is configured, then the Query component will only be able to query data that is longer than 2 h.
- When the storage time set by Prometheus is too long, it will cause the Query to query long-period data and cannot effectively use Store Gaway to query downsampled data, but need to wait for Prometheus to return results as well, which cannot improve query performance.
- The query performance improvement from Thanos can only be felt when the Prometheus source is plugged into the Query component and set to short-period.
Typically, setting the --storage.tsdb.retention.time parameter of Prometheus to 3 times the Sidecar upload storage block period, i.e. 3 * 2 h = 6 h, is sufficient.
4. Tuning Store Gateway to speed up queries
The Thanos Store component provides an external interface to Thanos Query queries based on the metrics data in the object store.The Store component provides a number of parameters that can be used to optimize queries.
4.1 Setting the cache
--index-cache-size=250MB will use memory cache by default to speed up the query. Other optional caches include, memcached, redis.
4.2 Setting the query range
The -min-time and -max-time parameters specify the range of data that can be queried by the current Store.
You can specify -min-time=2018-01-01T00:00:00Z,--max-time=2019-01-01T23:59:59Z directly according to the RFC3339 specification, or you can specify a relative time -min-time=-6w,--max-time=-2w to allow querying only for data that is 2 weeks old but not more than 6 weeks old. but not more than 6 weeks ago.
This approach not only controls the scope of the query, but also speeds up the return of data from the interface and blocks unnecessary query results.
5 Redesigning the tagging system
After using Thanos Query to merge multiple Prometheus data sources, the first problem you encounter is how to distinguish the data from different data sources. If you don’t plan external_labels in advance, the metrics from various environments and regions will be mixed together and will not be usable at all.
As shown in the figure below, you need to set some necessary Labels information in each Prometheus instance to distinguish the data of different Prometheus instances.
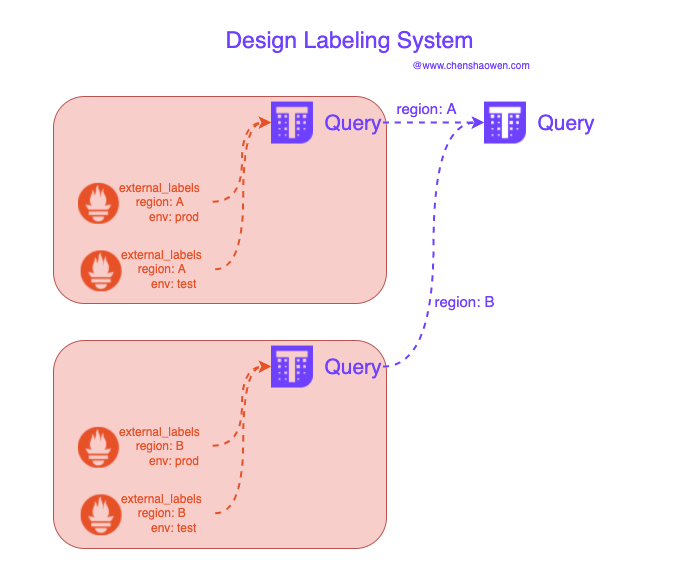
On the other hand, you will need to take these tags with you when querying and using the monitored metrics data. This workload is reflected in the modification of Grafana’s presentation panel and the parameter tuning of the query API.
6. Summary
This article is a summary of some thoughts on using Thanos in a production environment. The goal when I first started using Thanos was to be able to deploy it; the goal after I deployed it online was to be able to use it; and the final goal was to be able to anticipate some future problems and solve them in advance.