1. Background Notes
1.1 Requirement Description
For SRE team, it is critical to implement monitoring of large-scale GPU resources on AI and high performance computing platforms.SRE team can understand workload and other related performance through GPU metrics to optimize resource allocation, improve resource utilization and abnormality diagnosis to improve the overall performance of data center resources. In addition to SRE and infrastructure teams, whether you are a researcher working on GPU acceleration direction or a data center architect, you can understand GPU utilization and work saturation for capacity planning and task scheduling, etc. through relevant monitoring metrics.
With the containerization of AI/ML workloads and the adoption of Kubernetes solutions with dynamic scaling features for scheduling platforms, the urgency of monitoring for them is increasing. In this article, we will introduce NVIDIA Data Center GPU Manager (DCGM) and how it can be integrated into open source tools such as Prometheus and Grafana to enable a holistic solution for GPU monitoring in Kubernetes.
1.2 NVIDIA DCGM
NVIDIA DCGM is an all-in-one tool for managing and monitoring large-scale clusters of NVIDIA GPUs on Linux-based systems. It is a low-overhead tool that provides a variety of capabilities including active health monitoring, diagnostics, system validation, policy, power and clock management, configuration management, and auditing.
DCGM provides APIs for collecting GPU telemetry. of particular interest are GPU utilization metrics, memory metrics, and traffic metrics. DCGM provides clients for various languages such as C and Python. for integration with the container ecosystem, a Go-bound implementation based on DCGM APIs is provided.
1.3 NVIDIA exporter
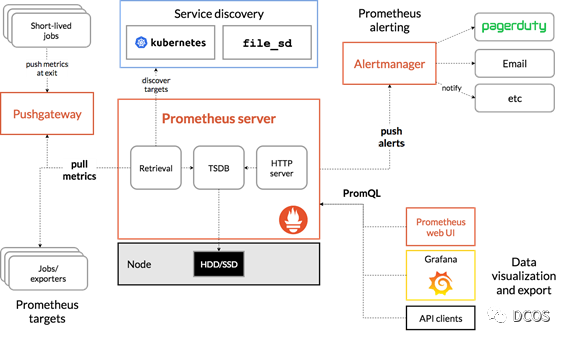
Monitoring systems typically consist of a metrics collector, a time series database for storing metrics, and visual components. An example is the CNCF graduation project Prometheus, which together with Grafana forms a monitoring integration solution. Prometheus, kube-state-metrics, and node_exporter are deployed together to capture cluster metrics and node metrics such as CPU utilization for Kubernetes API objects. The following figure shows an example architecture of Prometheus.
Building on the Go API described earlier, GPU metrics can be exposed to Prometheus via DCGM. NVIDIA has built the dcgm-exporter project for this purpose.
The dcgm-exporter uses Go bindings to collect GPU telemetry data from DCGM and then expose the metrics to Prometheus via the http interface (/metrics).
The dcgm-exporter can customize the GPU metrics collected by DCGM by using a configuration file in csv format.
1.4 Kubelet Device Monitoring
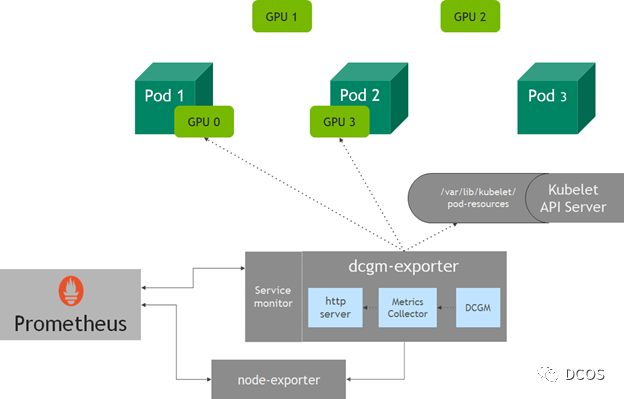
The dcgm-exporter collects metrics for all available GPUs on a node. However, in Kubernetes, when a node requests GPU resources, it may not be possible to determine which GPUs will be assigned to pods. starting with v1.13, Kubelet adds a device monitoring feature that allows the pod-resources socket to know the devices assigned to pods, which includes the pod name, pod namespace, and device ID.
The http service in dcgm-exporter connects to the pod-resources service in kubelet (/var/lib/kubelet/pod-resources) to identify the GPU device running on the pod and adds the pod-related information of the GPU device to the collected metrics.
2. GPU monitoring
2.1 Deployment Instructions
Here are some examples of setting up the dcgm-exporter. If using NVIDIA GPU Operator, then dcgm-exporter is also one of the deployment components.
The documentation contains steps for setting up a Kubernetes cluster. For brevity, it is assumed that a Kubernetes cluster already exists with NVIDIA software components running, such as drivers, container runtimes, and Kubernetes device plug-ins. Grafana can also be easily deployed when deploying Prometheus using Prometheus Operator, and in that article, a single-node Kubernetes cluster was used for simplicity.
When setting up the community-provided Helm chart for Prometheus Operator, Grafana must be exposed for external access, and prometheusSpec.serviceMonitorSelectorNilUsesHelmValues must be set to false.
In short, setting up monitoring consists of running the following command.
 1
 2
 3
 4
 5
 6
 7
 8
 9
10
11
12
13
14
|
 helm repo add prometheus-community \
https://prometheus-community.github.io/helm-charts

$ helm repo update
$ helm inspect values prometheus-community/kube-prometheus-stack > /tmp/kube-prometheus-stack.values
# Edit /tmp/kube-prometheus-stack.values in your favorite editor
# according to the documentation
# This exposes the service via NodePort so that Prometheus/Grafana
# are accessible outside the cluster with a browser
$ helm install prometheus-community/kube-prometheus-stack \
--create-namespace --namespace prometheus \
--generate-name \
--set prometheus.service.type=NodePort \
--set prometheus.prometheusSpec.serviceMonitorSelectorNilUsesHelmValues=false
|
At this point, the cluster is configured as shown below, where all Prometheus pods and services are healthy and running.
 1
 2
 3
 4
 5
 6
 7
 8
 9
10
11
12
13
14
15
16
17
18
19
20
21
22
23
24
25
26
27
28
29
30
31
32
33
34
35
36
37
38
39
|
$ kubectl get pods -A
NAMESPACE     NAME                                                              READY   STATUS    RESTARTS   AGE
kube-system   calico-kube-controllers-8f59968d4-zrsdt                           1/1     Running   0          18m
kube-system   calico-node-c257f                                                 1/1     Running   0          18m
kube-system   coredns-f9fd979d6-c52hz                                           1/1     Running   0          19m
kube-system   coredns-f9fd979d6-ncbdp                                           1/1     Running   0          19m
kube-system   etcd-ip-172-31-27-93                                              1/1     Running   1          19m
kube-system   kube-apiserver-ip-172-31-27-93                                    1/1     Running   1          19m
kube-system   kube-controller-manager-ip-172-31-27-93                           1/1     Running   1          19m
kube-system   kube-proxy-b9szp                                                  1/1     Running   1          19m
kube-system   kube-scheduler-ip-172-31-27-93                                    1/1     Running   1          19m
kube-system   nvidia-device-plugin-1602308324-jg842                             1/1     Running   0          17m
prometheus    alertmanager-kube-prometheus-stack-1602-alertmanager-0            2/2     Running   0          92s
prometheus    kube-prometheus-stack-1602-operator-c4bc5c4d5-f5vzc               2/2     Running   0          98s
prometheus    kube-prometheus-stack-1602309230-grafana-6b4fc97f8f-66kdv         2/2     Running   0          98s
prometheus    kube-prometheus-stack-1602309230-kube-state-metrics-76887bqzv2b   1/1     Running   0          98s
prometheus    kube-prometheus-stack-1602309230-prometheus-node-exporter-rrk9l   1/1     Running   0          98s
prometheus    prometheus-kube-prometheus-stack-1602-prometheus-0                3/3     Running   1          92s


$ kubectl get svc -A
NAMESPACE     NAME                                                        TYPE        CLUSTER-IP       EXTERNAL-IP   PORT(S)                        AGE
default       kubernetes                                                  ClusterIP   10.96.0.1        <none>        443/TCP                        20m
kube-system   kube-dns                                                    ClusterIP   10.96.0.10       <none>        53/UDP,53/TCP,9153/TCP         20m
kube-system   kube-prometheus-stack-1602-coredns                          ClusterIP   None             <none>        9153/TCP                       2m18s
kube-system   kube-prometheus-stack-1602-kube-controller-manager          ClusterIP   None             <none>        10252/TCP                      2m18s
kube-system   kube-prometheus-stack-1602-kube-etcd                        ClusterIP   None             <none>        2379/TCP                       2m18s
kube-system   kube-prometheus-stack-1602-kube-proxy                       ClusterIP   None             <none>        10249/TCP                      2m18s
kube-system   kube-prometheus-stack-1602-kube-scheduler                   ClusterIP   None             <none>        10251/TCP                      2m18s
kube-system   kube-prometheus-stack-1602-kubelet                          ClusterIP   None             <none>        10250/TCP,10255/TCP,4194/TCP   2m12s
prometheus    alertmanager-operated                                       ClusterIP   None             <none>        9093/TCP,9094/TCP,9094/UDP     2m12s
prometheus    kube-prometheus-stack-1602-alertmanager                     ClusterIP   10.104.106.174   <none>        9093/TCP                       2m18s
prometheus    kube-prometheus-stack-1602-operator                         ClusterIP   10.98.165.148    <none>        8080/TCP,443/TCP               2m18s
prometheus    kube-prometheus-stack-1602-prometheus                       NodePort    10.105.3.19      <none>        9090:30090/TCP                 2m18s
prometheus    kube-prometheus-stack-1602309230-grafana                    ClusterIP   10.100.178.41    <none>        80/TCP                         2m18s
prometheus    kube-prometheus-stack-1602309230-kube-state-metrics         ClusterIP   10.100.119.13    <none>        8080/TCP                       2m18s
prometheus    kube-prometheus-stack-1602309230-prometheus-node-exporter   ClusterIP   10.100.56.74     <none>        9100/TCP                       2m18s
prometheus    prometheus-operated                                         ClusterIP   None             <none>        9090/TCP                       2m12s
|
2.2 Deploy dcgm-exporter
1
2
3
|
$ helm repo add gpu-helm-charts \
https://nvidia.github.io/gpu-monitoring-tools/helm-charts
$ helm repo update
|
Installation with helm.
1
2
3
|
$ helm install \
   --generate-name \
   gpu-helm-charts/dcgm-exporter
|
Result Verification.
1
2
3
4
5
|
$ helm ls
NAME                            NAMESPACE       REVISION        APP VERSION
dcgm-exporter-1-1601677302      default         1               dcgm-exporter-1.1.0             2.0.10
nvidia-device-plugin-1601662841 default         1          nvidia-device-plugin-0.7.0      0.7.0
|
Prometheus and Grafana services are exposed as follows.
 1
 2
 3
 4
 5
 6
 7
 8
 9
10
11
12
13
14
15
16
17
18
19
20
|
$ kubectl get svc -A
NAMESPACE     NAME                                                      TYPE        CLUSTER-IP       EXTERNAL-IP   PORT(S)                        AGE
default       dcgm-exporter                                             ClusterIP   10.99.34.128     <none>        9400/TCP                       43d
default       kubernetes                                                  ClusterIP   10.96.0.1        <none>        443/TCP                        20m
kube-system   kube-dns                                                    ClusterIP   10.96.0.10       <none>        53/UDP,53/TCP,9153/TCP         20m
kube-system   kube-prometheus-stack-1602-coredns                          ClusterIP   None             <none>        9153/TCP                       2m18s
kube-system   kube-prometheus-stack-1602-kube-controller-manager          ClusterIP   None             <none>        10252/TCP                      2m18s
kube-system   kube-prometheus-stack-1602-kube-etcd                        ClusterIP   None             <none>        2379/TCP                       2m18s
kube-system   kube-prometheus-stack-1602-kube-proxy                       ClusterIP   None             <none>        10249/TCP                      2m18s
kube-system   kube-prometheus-stack-1602-kube-scheduler                   ClusterIP   None             <none>        10251/TCP                      2m18s
kube-system   kube-prometheus-stack-1602-kubelet                          ClusterIP   None             <none>        10250/TCP,10255/TCP,4194/TCP   2m12s
prometheus    alertmanager-operated                                       ClusterIP   None             <none>        9093/TCP,9094/TCP,9094/UDP     2m12s
prometheus    kube-prometheus-stack-1602-alertmanager                     ClusterIP   10.104.106.174   <none>        9093/TCP                       2m18s
prometheus    kube-prometheus-stack-1602-operator                         ClusterIP   10.98.165.148    <none>        8080/TCP,443/TCP               2m18s
prometheus    kube-prometheus-stack-1602-prometheus                       NodePort    10.105.3.19      <none>        9090:30090/TCP                 2m18s
prometheus    kube-prometheus-stack-1602309230-grafana                    ClusterIP   10.100.178.41    <none>        80:32032/TCP                   2m18s
prometheus    kube-prometheus-stack-1602309230-kube-state-metrics         ClusterIP   10.100.119.13    <none>        8080/TCP                       2m18s
prometheus    kube-prometheus-stack-1602309230-prometheus-node-exporter   ClusterIP   10.100.56.74     <none>        9100/TCP                       2m18s
prometheus    prometheus-operated                                         ClusterIP   None             <none>        9090/TCP                       2m12s
|
Access the Grafana home page using the Grafana service exposed on port 32032. Login to the dashboard using the credentials set in the Prometheus chart: adminPassword field in prometheus.values.
Now to start a Grafana dashboard for GPU metrics, import the NVIDIA dashboard from the Grafana dashboard (https://grafana.com/grafana/dashboards/12239).
View DCGM metrics
Now run some GPU workloads, for this purpose, the DCGM community provides a CUDA load generator called dcgmproftester, which can be used to generate deterministic CUDA workloads for reading and verifying GPU metrics.
To generate a Pod, you must first download DCGM and make an image of it. The following script creates a container that can be used to run dcgmproftester. This container can be found in the NVIDIA DockerHub repository.
 1
 2
 3
 4
 5
 6
 7
 8
 9
10
11
12
13
14
15
16
17
18
19
20
21
22
23
24
25
26
27
28
29
30
31
32
33
34
35
36
37
38
39
40
41
42
43
|
#!/usr/bin/env bash
set -exo pipefail

mkdir -p /tmp/dcgm-docker
pushd /tmp/dcgm-docker

cat > Dockerfile <<EOF
ARG BASE_DIST
ARG CUDA_VER
FROM nvidia/cuda:\${CUDA_VER}-base-\${BASE_DIST}
LABEL io.k8s.display-name="NVIDIA dcgmproftester"

ARG DCGM_VERSION

WORKDIR /dcgm
RUN apt-get update && apt-get install -y --no-install-recommends \
    libgomp1 \
    wget && \
    rm -rf /var/lib/apt/lists/* && \
    wget --no-check-certificate https://developer.download.nvidia.com/compute/redist/dcgm/\${DCGM_VERSION}/DEBS/datacenter-gpu-manager_\${DCGM_VERSION}_amd64.deb && \
    dpkg -i datacenter-gpu-manager_*.deb && \
    rm -f datacenter-gpu-manager_*.deb

ENTRYPOINT ["/usr/bin/dcgmproftester11"]
EOF

DIR=.
DCGM_REL_VERSION=2.0.10
BASE_DIST=ubuntu18.04
CUDA_VER=11.0
IMAGE_NAME=nvidia/samples:dcgmproftester-$DCGM_REL_VERSION-cuda$CUDA_VER-$BASE_DIST


docker build --pull \
        -t "$IMAGE_NAME" \
        --build-arg DCGM_VERSION=$DCGM_REL_VERSION \
        --build-arg BASE_DIST=$BASE_DIST \
        --build-arg CUDA_VER=$CUDA_VER \
        --file Dockerfile \
        "$DIR"

popd
|
Before deploying a container on a Kubernetes cluster, try running it directly using Docker. In this example, use Tensor Cores to trigger FP16 matrix multiplication by specifying -t 1004 and run the test at -d 45 (45 seconds). You can try to run other workloads by modifying the -t parameter.
 1
 2
 3
 4
 5
 6
 7
 8
 9
10
11
12
13
14
|
Skipping CreateDcgmGroups() since DCGM validation is disabled
CU_DEVICE_ATTRIBUTE_MAX_THREADS_PER_MULTIPROCESSOR: 1024
CU_DEVICE_ATTRIBUTE_MULTIPROCESSOR_COUNT: 40
CU_DEVICE_ATTRIBUTE_MAX_SHARED_MEMORY_PER_MULTIPROCESSOR: 65536
CU_DEVICE_ATTRIBUTE_COMPUTE_CAPABILITY_MAJOR: 7
CU_DEVICE_ATTRIBUTE_COMPUTE_CAPABILITY_MINOR: 5
CU_DEVICE_ATTRIBUTE_GLOBAL_MEMORY_BUS_WIDTH: 256
CU_DEVICE_ATTRIBUTE_MEMORY_CLOCK_RATE: 5001000
Max Memory bandwidth: 320064000000 bytes (320.06 GiB)
CudaInit completed successfully.

Skipping WatchFields() since DCGM validation is disabled
TensorEngineActive: generated ???, dcgm 0.000 (27605.2 gflops)
TensorEngineActive: generated ???, dcgm 0.000 (28697.6 gflops)
|
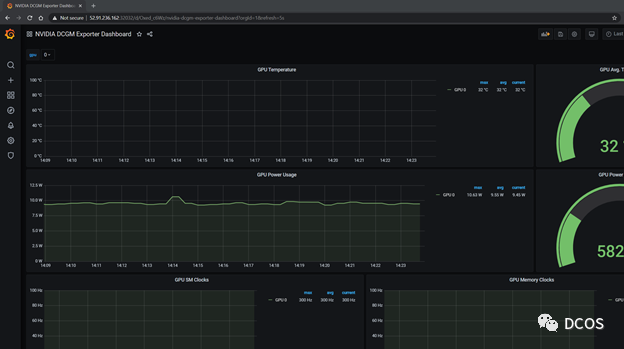
Deploy it to a Kubernetes cluster and you can observe the corresponding metrics through the Grafana dashboard. The sample code is shown below.
 1
 2
 3
 4
 5
 6
 7
 8
 9
10
11
12
13
14
15
16
17
18
19
|
 cat << EOF | kubectl create -f -
 apiVersion: v1
 kind: Pod
 metadata:
   name: dcgmproftester
 spec:
   restartPolicy: OnFailure
   containers:
   - name: dcgmproftester11
     image: nvidia/samples:dcgmproftester-2.0.10-cuda11.0-ubuntu18.04
     args: ["--no-dcgm-validation", "-t 1004", "-d 120"]
     resources:
       limits:
          nvidia.com/gpu: 1
     securityContext:
       capabilities:
          add: ["SYS_ADMIN"]

EOF
|
The dcgmproftester pod can be seen running healthily and the metrics are subsequently displayed on the Grafana dashboard. GPU utilization (GrActive) has reached a peak utilization of 98% and other interesting metrics may be found, such as power or GPU memory.
1
2
3
4
5
6
|
$ kubectl get pods -A
NAMESPACE     NAME
READY   STATUS    RESTARTS   AGE
...
default       dcgmproftester
1/1     Running   0          6s
|
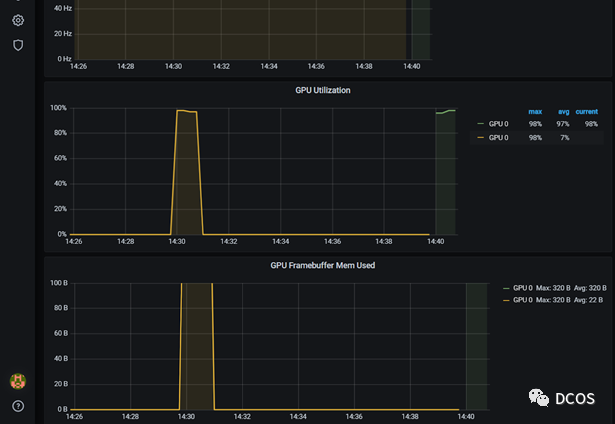
DCGM has recently added a number of device-level metrics. These include fine-grained GPU utilization metrics that monitor SM occupancy and Tensor Core utilization. For more information, see Profiling Metrics in the DCGM User Guide.
The following figure shows the monitoring metrics provided by dcgm-exporter as fetched by Prometheus.
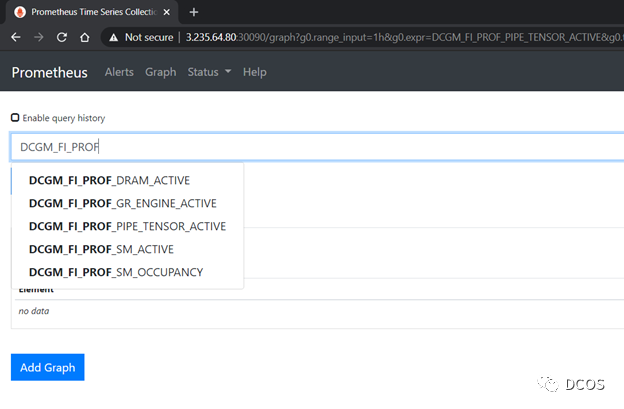
You can customize the Grafana dashboard to include additional metrics from DCGM. In this case, add Tensor Core utilization to the dashboard by editing the Grafana JSON file provided on the repo, or you can use Grafana’s web interface for editing.
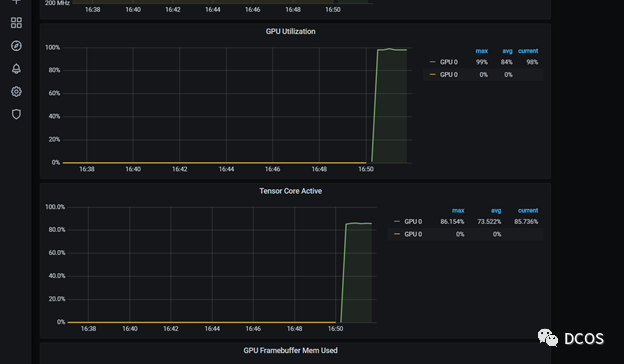
The dashboard below includes Tensor Core utilization. After restarting the dcgmproftester container, you can see that Tensor Core on T4 has reached about 87% utilization.
By using GPU metrics as custom metrics and Prometheus Adapter, you can use Horizontal Pod Autoscaler to scale the number of Pods based on GPU utilization or other metrics.