We have already introduced the possibility of using vmagent instead of prometheus to capture monitoring metrics data, to completely replace prometheus there is a very important part is the alarm module, before we are defined in prometheus alarm rules evaluation and sent to alertmanager, the same corresponds to the vm also has a special module to handle alarms: vmalert .
vmalert will execute the configured alarm or logging rule for the -datasource.url address, and then can send the alarm to the Alertmanager configured with -notifier.url. The logging rule results will be saved via the remote write protocol, so you need to configure -remoteWrite.url.
Features
- Integration with VictoriaMetrics TSDB
- VictoriaMetrics MetricsQL support and expression validation
- Prometheus alert rule definition format support
- Integration with Alertmanager
- Ability to maintain alarm status on restart
- Graphite data source for alarms and logging rules
- Support for logging and alarm rule replay
- Very lightweight, no additional dependencies
To start using vmalert, the following conditions need to be met.
- Alarm rule list: PromQL/MetricsQL expressions to be executed
- Data source address: an accessible instance of VictoriaMetrics for rule execution
- Notifier address: an accessible instance of Alertmanager for processing, aggregating alerts and sending notifications
Installation
First of all, you need to install an Alertmanager to receive alarm messages, which we have already explained in detail in the previous chapters, so we won’t repeat it here.
 1
 2
 3
 4
 5
 6
 7
 8
 9
10
11
12
13
14
15
16
17
18
19
20
21
22
23
24
25
26
27
28
29
30
31
32
33
34
35
36
37
38
39
40
41
42
43
44
45
46
47
48
49
50
51
52
53
54
55
56
57
58
59
60
61
62
63
64
65
66
67
68
69
70
71
72
73
74
75
76
|
# alertmanager.yaml
apiVersion: v1
kind: ConfigMap
metadata:
  name: alert-config
  namespace: kube-vm
data:
  config.yml: |-
    global:
      resolve_timeout: 5m
      smtp_smarthost: 'smtp.163.com:465'
      smtp_from: 'xxx@163.com'
      smtp_auth_username: 'xxx@163.com'
      smtp_auth_password: '<auth code>'  # 使用网易邮箱的授权码
      smtp_hello: '163.com'
      smtp_require_tls: false
    route:
      group_by: ['severity', 'source']
      group_wait: 30s
      group_interval: 5m
      repeat_interval: 24h
      receiver: email
    receivers:
    - name: 'email'
      email_configs:
      - to: 'xxxxxx@qq.com'
        send_resolved: true
---
apiVersion: v1
kind: Service
metadata:
  name: alertmanager
  namespace: kube-vm
  labels:
    app: alertmanager
spec:
  selector:
    app: alertmanager
  type: NodePort
  ports:
    - name: web
      port: 9093
      targetPort: http
---
apiVersion: apps/v1
kind: Deployment
metadata:
  name: alertmanager
  namespace: kube-vm
  labels:
    app: alertmanager
spec:
  selector:
    matchLabels:
      app: alertmanager
  template:
    metadata:
      labels:
        app: alertmanager
    spec:
      volumes:
        - name: cfg
          configMap:
            name: alert-config
      containers:
        - name: alertmanager
          image: prom/alertmanager:v0.21.0
          imagePullPolicy: IfNotPresent
          args:
            - "--config.file=/etc/alertmanager/config.yml"
          ports:
            - containerPort: 9093
              name: http
          volumeMounts:
            - mountPath: "/etc/alertmanager"
              name: cfg
|
Alertmanager here we only configured a default routing rule, based on severity, source two tags for grouping, and then the triggered alarm will be sent to the email receiver.
Next, you need to add a rule configuration for alarms, configured in the same way as Prometheus.
 1
 2
 3
 4
 5
 6
 7
 8
 9
10
11
12
13
14
15
16
17
18
19
20
21
22
23
24
25
26
27
28
29
30
31
32
33
34
35
36
37
38
39
|
# vmalert-config.yaml
apiVersion: v1
kind: ConfigMap
metadata:
  name: vmalert-config
  namespace: kube-vm
data:
  record.yaml: |
    groups:
    - name: record
      rules:
      - record: job:node_memory_MemFree_bytes:percent  # 记录规则名称
        expr: 100 - (100 * node_memory_MemFree_bytes / node_memory_MemTotal_bytes)
  pod.yaml: |
    groups:
    - name: pod
      rules:
      - alert: PodMemoryUsage
        expr: sum(container_memory_working_set_bytes{pod!=""}) BY (instance, pod)  / sum(container_spec_memory_limit_bytes{pod!=""} > 0) BY (instance, pod) * 100 > 60
        for: 2m
        labels:
          severity: warning
          source: pod
        annotations:
          summary: "Pod {{ $labels.pod }} High Memory usage detected"
          description: "{{$labels.instance}}: Pod {{ $labels.pod }} Memory usage is above 60% (current value is: {{ $value }})"
  node.yaml: |
    groups:
    - name: node
      rules:  # 具体的报警规则
      - alert: NodeMemoryUsage  # 报警规则的名称
        expr: (node_memory_MemTotal_bytes - (node_memory_MemFree_bytes + node_memory_Buffers_bytes + node_memory_Cached_bytes)) / node_memory_MemTotal_bytes * 100 > 30
        for: 1m
        labels:
          source: node
          severity: critical
        annotations:
          summary: "Node {{$labels.instance}} High Memory usage detected"
          description: "{{$labels.instance}}: Memory usage is above 30% (current value is: {{ $value }})"
|
Here we have added one record rule and two alarm rules, more alarm rule configurations can be found at https://awesome-prometheus-alerts.grep.to/ .
Then you can deploy the vmalert component service.
 1
 2
 3
 4
 5
 6
 7
 8
 9
10
11
12
13
14
15
16
17
18
19
20
21
22
23
24
25
26
27
28
29
30
31
32
33
34
35
36
37
38
39
40
41
42
43
44
45
46
47
48
49
50
51
52
|
# vmalert.yaml
apiVersion: v1
kind: Service
metadata:
  name: vmalert
  namespace: kube-vm
  labels:
    app: vmalert
spec:
  ports:
    - name: vmalert
      port: 8080
      targetPort: 8080
  type: NodePort
  selector:
    app: vmalert
---
apiVersion: apps/v1
kind: Deployment
metadata:
  name: vmalert
  namespace: kube-vm
  labels:
    app: vmalert
spec:
  selector:
    matchLabels:
      app: vmalert
  template:
    metadata:
      labels:
        app: vmalert
    spec:
      containers:
        - name: vmalert
          image: victoriametrics/vmalert:v1.77.0
          imagePullPolicy: IfNotPresent
          args:
            - -rule=/etc/ruler/*.yaml
            - -datasource.url=http://vmselect.kube-vm.svc.cluster.local:8481/select/0/prometheus
            - -notifier.url=http://alertmanager.kube-vm.svc.cluster.local:9093
            - -remoteWrite.url=http://vminsert.kube-vm.svc.cluster.local:8480/insert/0/prometheus
            - -evaluationInterval=15s
            - -httpListenAddr=0.0.0.0:8080
          volumeMounts:
            - mountPath: /etc/ruler/
              name: ruler
              readOnly: true
      volumes:
        - configMap:
            name: vmalert-config
          name: ruler
|
The above resource list mounts the alarm rules as volumes in the container, specifying the rule file path by -rule, the vmselect path by -datasource.url, the Alertmanager address by -notifier.url, and the frequency of evaluation by - evaluationInterval parameter is used to specify the evaluation frequency, and since we have added logging rules here, we also need to specify a remote write address via -remoteWrite.url.
Create the above resource list directly to complete the deployment.
 1
 2
 3
 4
 5
 6
 7
 8
 9
10
11
12
13
14
15
|
☸ ➜ kubectl apply -f https://p8s.io/docs/victoriametrics/manifests/alertmanager.yaml
☸ ➜ kubectl apply -f https://p8s.io/docs/victoriametrics/manifests/vmalert-config.yaml
☸ ➜ kubectl apply -f https://p8s.io/docs/victoriametrics/manifests/vmalert.yaml
☸ ➜ kubectl get pods -n kube-vm -l app=alertmanager
NAME                           READY   STATUS    RESTARTS   AGE
alertmanager-d88d95b4f-z2j8g   1/1     Running   0          30m
☸ ➜ kubectl get svc -n kube-vm -l app=alertmanager
NAME           TYPE       CLUSTER-IP     EXTERNAL-IP   PORT(S)          AGE
alertmanager   NodePort   10.100.230.2   <none>        9093:31282/TCP   31m
☸ ➜ kubectl get pods -n kube-vm -l app=vmalert
NAME                       READY   STATUS    RESTARTS   AGE
vmalert-866674b966-675nb   1/1     Running   0          7m17s
☸ ➜ kubectl get svc -n kube-vm -l app=vmalert
NAME      TYPE       CLUSTER-IP       EXTERNAL-IP   PORT(S)          AGE
vmalert   NodePort   10.104.193.183   <none>        8080:30376/TCP   22m
|
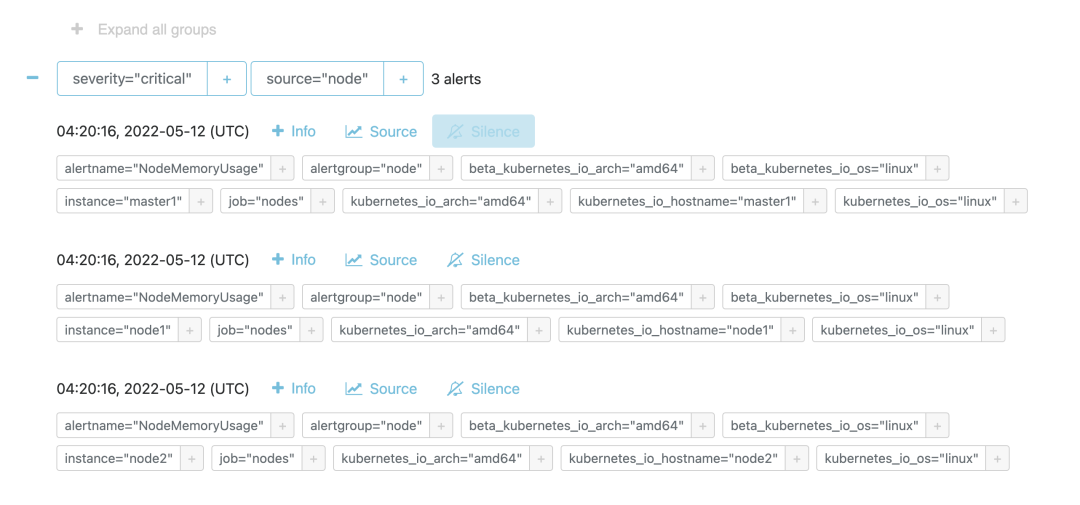
After successful deployment, if an alarm rule reaches the threshold value, it will trigger an alarm, and we can view the triggered alarm rules through the Alertmanager page.

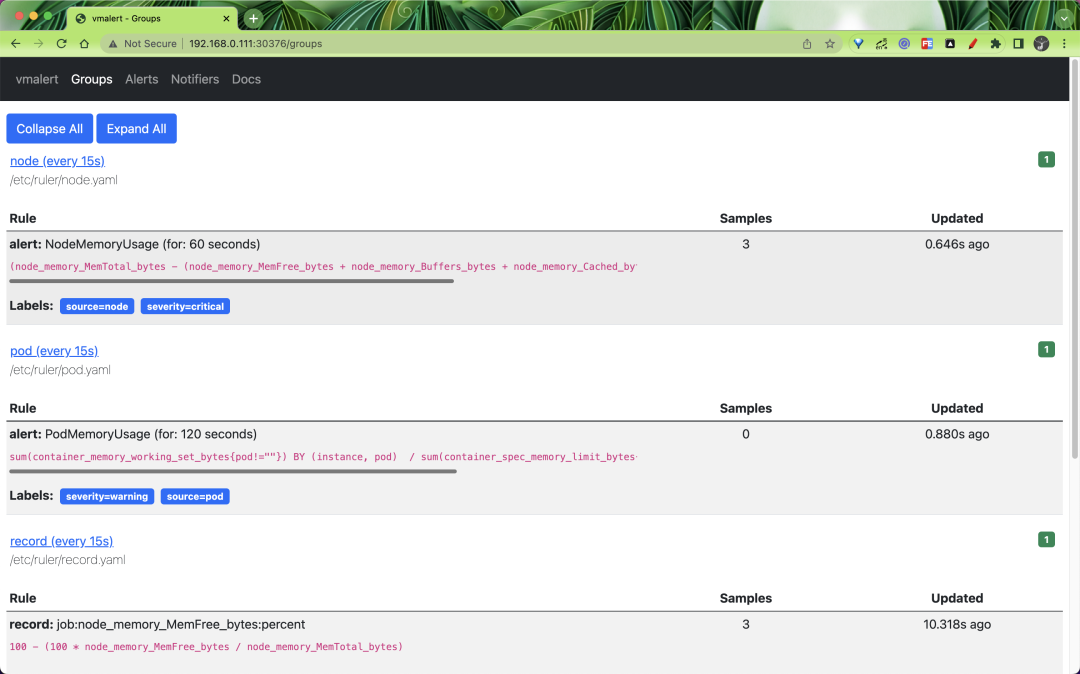
Likewise vmalert provides a simple page to view all Groups.

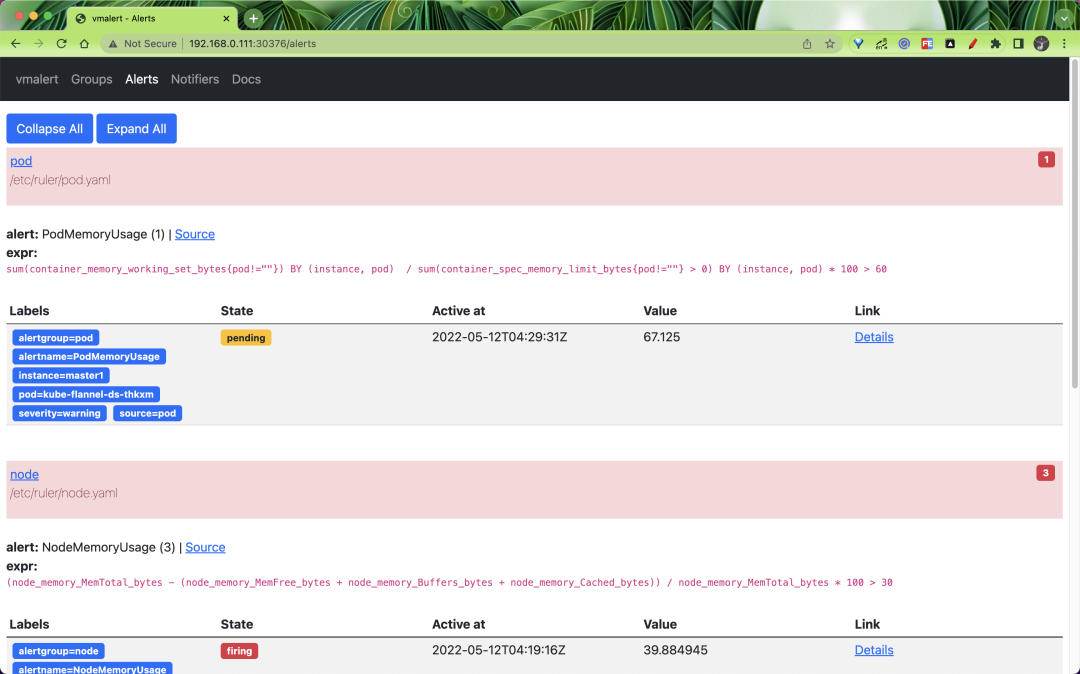
The status of the alarm rule list can also be viewed.

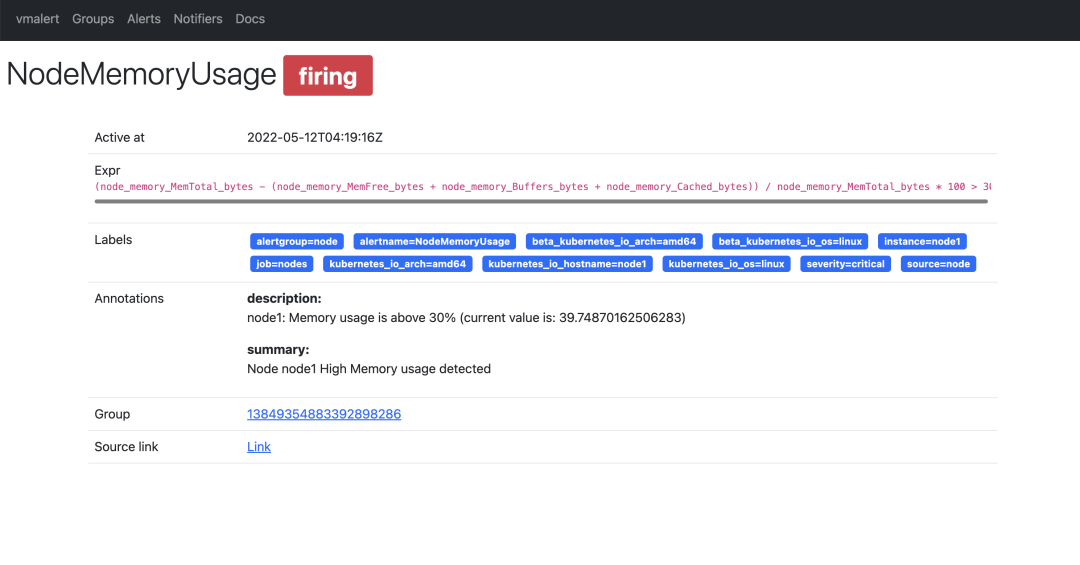
You can also view the details of a specific alarm rule, as shown below.

How is an alarm rule sent after it is triggered? It is up to Alertmanager to decide which receiver to send it to.
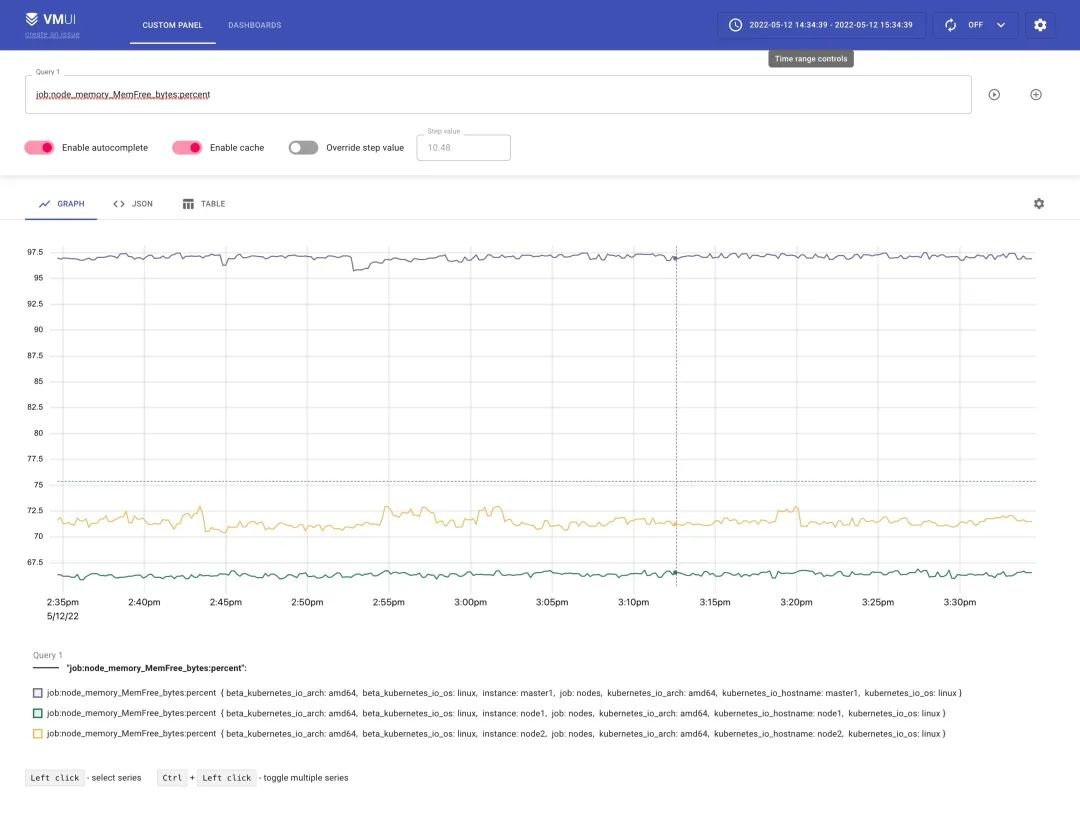
Similarly the logging rules we added above will be passed to vminsert via remote write and retained, so we can also query them via vmselect.

Here we basically finished using vm instead of prometheus for monitoring and alerting. vmagent collects monitoring indicators, vmalert is used for alarm monitoring, vmstorage stores indicator data, vminsert receives indicator data, and vmselect queries indicator data, which can completely eliminate the use of prometheus, and the performance is very high and the resources required are much lower than prometheus.
