For comparison between different VictoriaMetrics versions or between VictoriaMetrics and other solutions that support the Prometheus remote_write protocol, VictoriaMetrics provides a dedicated Prometheus-benchmark project.
Implementation principle
The implementation of this project is actually very simple.
- Use
node_exporter as a source for production-like metrics.
- use nginx as a caching proxy in front of
node_exporter to reduce the load on node_exporter when it crawls too many metrics.
- Use
vmagent to grab node_exporter metrics and forward them to the configured target using the Prometheus remote_write protocol. If multiple targets are set, multiple vmagent instances push the crawled data to those targets independently.
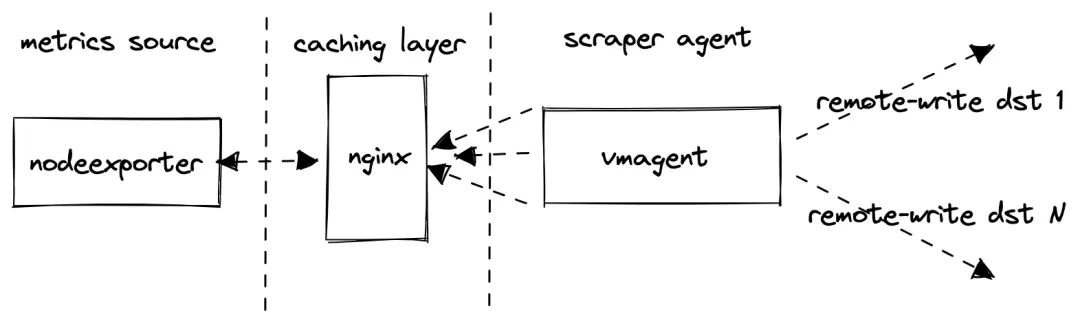
However, note that the test does not collect metrics from the configured remote_write target, it only collects metrics from the internal components vmagent and vmalert, he will assume that the monitoring of the Prometheus storage system under test is done separately, for example, here we take a single node VictoriaMetrics as the target of remote_write, then we can monitor it ourselves.
The core implementation of the project is to continuously update the configuration file for grabbing metrics based on a set of incoming parameters, and then vmagent gets its configuration -promscrape.config to grab the metrics based on the interface exposed by the project, and the core code is as follows.
  1
  2
  3
  4
  5
  6
  7
  8
  9
 10
 11
 12
 13
 14
 15
 16
 17
 18
 19
 20
 21
 22
 23
 24
 25
 26
 27
 28
 29
 30
 31
 32
 33
 34
 35
 36
 37
 38
 39
 40
 41
 42
 43
 44
 45
 46
 47
 48
 49
 50
 51
 52
 53
 54
 55
 56
 57
 58
 59
 60
 61
 62
 63
 64
 65
 66
 67
 68
 69
 70
 71
 72
 73
 74
 75
 76
 77
 78
 79
 80
 81
 82
 83
 84
 85
 86
 87
 88
 89
 90
 91
 92
 93
 94
 95
 96
 97
 98
 99
100
101
102
103
104
105
106
107
108
109
110
111
112
113
114
115
116
117
118
119
120
121
122
123
|
package main

import (
 "flag"
 "fmt"
 "log"
 "math/rand"
 "net/http"
 "sync"
 "time"

 "gopkg.in/yaml.v2"
)

var (
 listenAddr                 = flag.String("httpListenAddr", ":8436", "TCP address for incoming HTTP requests")
 targetsCount               = flag.Int("targetsCount", 100, "The number of scrape targets to return from -httpListenAddr. Each target has the same address defined by -targetAddr")
 targetAddr                 = flag.String("targetAddr", "demo.robustperception.io:9090", "Address with port to use as target address the scrape config returned from -httpListenAddr")
 scrapeInterval             = flag.Duration("scrapeInterval", time.Second*5, "The scrape_interval to set at the scrape config returned from -httpListenAddr")
 scrapeConfigUpdateInterval = flag.Duration("scrapeConfigUpdateInterval", time.Minute*10, "The -scrapeConfigUpdatePercent scrape targets are updated in the scrape config returned from -httpListenAddr every -scrapeConfigUpdateInterval")
 scrapeConfigUpdatePercent  = flag.Float64("scrapeConfigUpdatePercent", 1, "The -scrapeConfigUpdatePercent scrape targets are updated in the scrape config returned from -httpListenAddr ever -scrapeConfigUpdateInterval")
)

func main() {
 flag.Parse()
 flag.VisitAll(func(f *flag.Flag) {
  log.Printf("-%s=%s", f.Name, f.Value)
 })
 c := newConfig(*targetsCount, *scrapeInterval, *targetAddr)
 var cLock sync.Mutex
 p := *scrapeConfigUpdatePercent / 100
 r := rand.New(rand.NewSource(time.Now().UnixNano()))
 go func() {
  rev := 0
  for range time.Tick(*scrapeConfigUpdateInterval) {
   rev++
   revStr := fmt.Sprintf("r%d", rev)
   cLock.Lock()
   for _, sc := range c.ScrapeConfigs {
    for _, stc := range sc.StaticConfigs {
     if r.Float64() >= p {
      continue
     }
     stc.Labels["revision"] = revStr
    }
   }
   cLock.Unlock()
  }
 }()
 rh := func(w http.ResponseWriter, r *http.Request) {
  cLock.Lock()
  data := c.marshalYAML()
  cLock.Unlock()
  w.Header().Set("Content-Type", "text/yaml")
  w.Write(data)
 }
 hf := http.HandlerFunc(rh)
 log.Printf("starting scrape config updater at http://%s/", *listenAddr)
 if err := http.ListenAndServe(*listenAddr, hf); err != nil {
  log.Fatalf("unexpected error when running the http server: %s", err)
 }
}

func (c *config) marshalYAML() []byte {
 data, err := yaml.Marshal(c)
 if err != nil {
  log.Fatalf("BUG: unexpected error when marshaling config: %s", err)
 }
 return data
}

func newConfig(targetsCount int, scrapeInterval time.Duration, targetAddr string) *config {
 scs := make([]*staticConfig, 0, targetsCount)
 for i := 0; i < targetsCount; i++ {
  scs = append(scs, &staticConfig{
   Targets: []string{targetAddr},
   Labels: map[string]string{
    "instance": fmt.Sprintf("host-%d", i),
    "revision": "r0",
   },
  })
 }
 return &config{
  Global: globalConfig{
   ScrapeInterval: scrapeInterval,
  },
  ScrapeConfigs: []*scrapeConfig{
   {
    JobName:       "node_exporter",
    StaticConfigs: scs,
   },
  },
 }
}

// config represents essential parts from Prometheus config defined at https://prometheus.io/docs/prometheus/latest/configuration/configuration/
type config struct {
 Global        globalConfig    `yaml:"global"`
 ScrapeConfigs []*scrapeConfig `yaml:"scrape_configs"`
}

// globalConfig represents essential parts for `global` section of Prometheus config.
//
// See https://prometheus.io/docs/prometheus/latest/configuration/configuration/
type globalConfig struct {
 ScrapeInterval time.Duration `yaml:"scrape_interval"`
}

// rapeConfig represents essential parts for `scrape_config` section of Prometheus config.
//
// See https://prometheus.io/docs/prometheus/latest/configuration/configuration/#scrape_config
type scrapeConfig struct {
 JobName       string          `yaml:"job_name"`
 StaticConfigs []*staticConfig `yaml:"static_configs"`
}

// staticConfig represents essential parts for `static_config` section of Prometheus config.
//
// See https://prometheus.io/docs/prometheus/latest/configuration/configuration/#static_config
type staticConfig struct {
 Targets []string          `yaml:"targets"`
 Labels  map[string]string `yaml:"labels"`
}
|
We can control the stress test by configuring some of the following parameters.
-
targetsCount
targetsCount defines how many node_exporter crawl targets are added to the vmagent crawl configuration, each containing a unique instance tag, and this parameter affects the number and base of crawl metrics. Typically, a node_exporter will generate about 815 unique indicators, so when targetsCount is set to 1000, the test will generate about 815*100=815K of active time series.
-
scrapeInterval
scrapeInterval defines the frequency of crawling each target, this parameter affects the data ingestion rate, the smaller the interval, the higher the data ingestion rate.
-
remoteStorage
remoteStorages contains a list of systems to test and push the crawled metrics to, if multiple targets are set, multiple vmagent instances will push the same data to multiple targets respectively.
-
Churn rate
scrapeConfigUpdatePercent and scrapeConfigUpdateInterval can be used to generate a non-zero time series churn rate, which is a very typical scenario in Kubernetes monitoring.
How it works
A typical scenario is to run multiple VictoriaMetrics and then list their addresses in the remoteStorages section. The default configuration for this test is targetsCount=1000 and scrapeInterval=10s resulting in approximately 80k samples/second.
1
|
800 metrics-per-target * 1k targets / 10s = 80k samples/s
|
We can then compare resource usage, data compression, and overall performance with VictoriaMetrics’ official Grafana dasbhoards.
The project is installed by default via Helm Chart, which by default installs a single instance of VictoriaMetrics in single mode, directly Clone the project.
1
2
|
$ git clone https://github.com/VictoriaMetrics/prometheus-benchmark
$ cd prometheus-benchmark
|
Then you can modify the chart/values.yaml configuration parameters according to your needs, my configuration here is as follows.
 1
 2
 3
 4
 5
 6
 7
 8
 9
10
11
12
13
14
15
16
17
18
19
20
21
22
23
24
25
26
27
28
29
30
31
32
33
34
35
36
37
38
39
40
41
42
43
44
45
46
47
48
49
50
51
52
53
54
55
56
57
58
59
60
61
62
63
64
65
|
vmtag: "v1.77.1"

# targetsCount defines the number of nodeexporter instances to scrape.
# This option allows to configure the number of active time series to push
# to remoteStorages.
# Every nodeexporter exposes around 815 unique metrics, so when targetsCount
# is set to 1000, then the benchmark generates around 815*100=815K active time series.
targetsCount: 2000

# scrapeInterval defines how frequently to scrape nodeexporter targets.
# This option allows to configure data ingestion rate per every remoteStorages.
# For example, if the benchmark generates 815K active time series and scrapeInterval
# is set to 10s, then the data ingestion rate equals to 815K/10s = 81.5K samples/sec.
scrapeInterval: 10s

# queryInterval is how often to send queries from files/alerts.yaml to remoteStorages.readURL
# This option can be used for tuning read load at remoteStorages.
# It is a good rule of thumb to keep it in sync with scrapeInterval.
queryInterval: 10s

# scrapeConfigUpdatePercent is the percent of nodeexporter targets
# which are updated with unique label on every scrape config update
# (see scrapeConfigUpdateInterval).
# This option allows tuning time series churn rate.
# For example, if scrapeConfigUpdatePercent is set to 1 for targetsCount=1000,
# then around 10 targets gets updated labels on every scrape config update.
# This generates around 815*10=8150 new time series every scrapeConfigUpdateInterval.
scrapeConfigUpdatePercent: 1

# scrapeConfigUpdateInterval specifies how frequently to update labels
# across scrapeConfigUpdatePercent nodeexporter targets.
# This option allows tuning time series churn rate.
# For example, if scrapeConfigUpdateInterval is set to 10m for targetsCount=1000
# and scrapeConfigUpdatePercent=1, then around 10 targets gets updated labels every 10 minutes.
# This generates around 815*10=8150 new time series every 10 minutes.
scrapeConfigUpdateInterval: 10m

# writeConcurrenty is the number of concurrent tcp connections to use
# for sending the data to the tested remoteStorages.
# Increase this value if there is a high network latency between prometheus-benchmark
# components and the tested remoteStorages.
writeConcurrency: 16

# remoteStorages contains a named list of Prometheus-compatible systems to test.
# These systems must support data ingestion via Prometheus remote_write protocol.
# These systems must also support Prometheus querying API if query performance
# needs to be measured additionally to data ingestion performance.
remoteStorages:
  vm-0:
    # writeURL 表示用来接收 Prometheus remote_write 协议的远程存储
    # 例如:
    # - 单节点VictoriaMetrics模式:http://<victoriametrics-addr>:8428/api/v1/write for single-node
    # - 集群VictoriaMetrics模式:http://<vminsert-addr>:8480/insert/0/prometheus/api/v1/write
    writeURL: "http://my-bench-prometheus-benchmark-vmsingle.default.svc.cluster.local:8428/api/v1/write"

    # readURL 是可选的,如果需要测试测试的性能则需要配置,通过发送报警规则(files/alerts.yaml)给 readURL 进行测试
    # 例如:
    # - 单节点VictoriaMetrics模式:http://<victoriametrics-addr>:8428/
    # - 集群VictoriaMetrics模式:http://<vmselect-addr>:8481/select/0/prometheus/
    readURL: "http://my-bench-prometheus-benchmark-vmsingle.default.svc.cluster.local:8428/"
    writeBearerToken: ""
    readBearerToken: ""
  # vm-1:  # 如果有多个远程存储系统可以继续配置即可
  #   writeURL: "http://victoria-metrics-victoria-metrics-cluster-vminsert.default.svc.cluster.local:8480/insert/1/prometheus/api/v1/write"
  #   readURL: "http://victoria-metrics-victoria-metrics-cluster-vmselect.default.svc.cluster.local:8481/select/1/prometheus/"
|
The project code now comes with a single-node VictoriaMetrics by default, but the Charts template does not have a Service object added to it, which is not very convenient to operate. Let’s add a chart/templates/vmsingle/service.yaml file with the following content.
 1
 2
 3
 4
 5
 6
 7
 8
 9
10
11
12
13
14
15
|
apiVersion: v1
kind: Service
metadata:
  name: {{ include "prometheus-benchmark.fullname" . }}-vmsingle
  namespace: {{ .Release.Namespace }}
  labels:
    {{- include "prometheus-benchmark.labels" . | nindent 4 }}
spec:
  type: ClusterIP
  selector:
    job: vmsingle
    {{- include "prometheus-benchmark.selectorLabels" . | nindent 4 }}
  ports:
  - port: 8428
    targetPort: 8428
|
After the configuration, execute the following command in the project root directory to start testing.
The above command will use Helm for installation.
 1
 2
 3
 4
 5
 6
 7
 8
 9
10
11
|
$ kubectl get pods
NAME                                                          READY   STATUS    RESTARTS   AGE
grafana-db468ccf9-mtn87                                       1/1     Running   0          90m
my-bench-prometheus-benchmark-nodeexporter-76c497cf59-m5k66   2/2     Running   0          49m
my-bench-prometheus-benchmark-vmagent-vm-0-6bcbbb5fd8-8rhcx   2/2     Running   0          49m
my-bench-prometheus-benchmark-vmalert-vm-0-6f6b565ccc-snsk5   2/2     Running   0          49m
my-bench-prometheus-benchmark-vmsingle-585579fbf5-cpzhg       1/1     Running   0          49m
$ kubectl get svc
NAME                                         TYPE        CLUSTER-IP      EXTERNAL-IP   PORT(S)    AGE
my-bench-prometheus-benchmark-nodeexporter   ClusterIP   10.96.156.144   <none>        9102/TCP   50m
my-bench-prometheus-benchmark-vmsingle       ClusterIP   10.96.75.242    <none>        8428/TCP   50m
|
One of the node-exporter applications contains two containers, one for the application itself and another for nginx wrapped with a layer to relieve the pressure on node-exporter. We can then configure Grafana to monitor the data source http://my-bench-prometheus-benchmark-vmsingle:8428 and import a few of the official Grafana Dashboards provided by VictorialMetrics: https://grafana.com/orgs/victoriametrics.
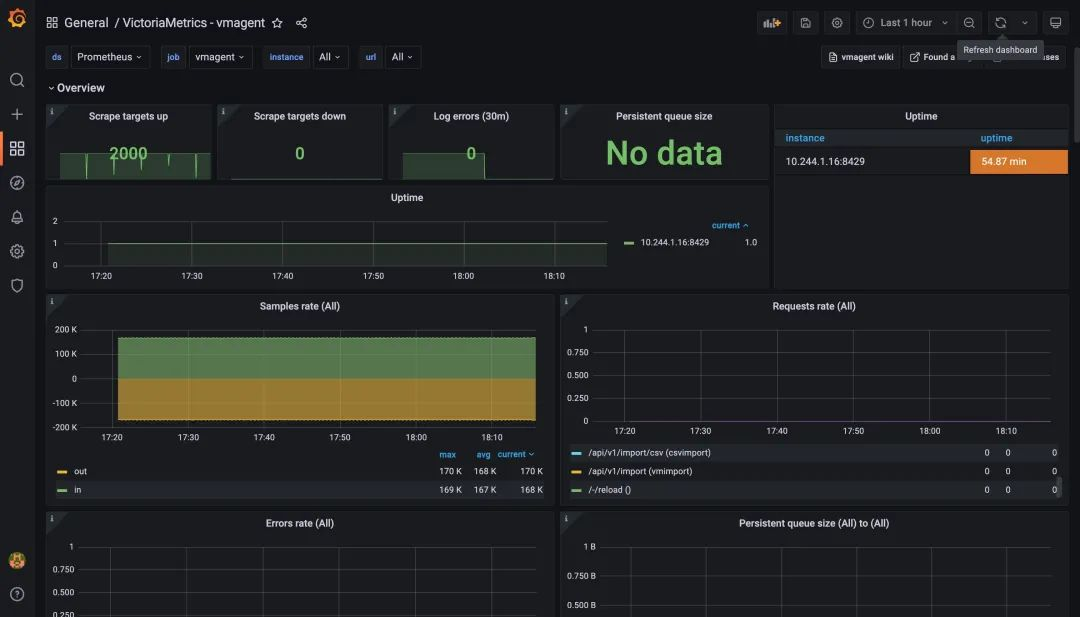
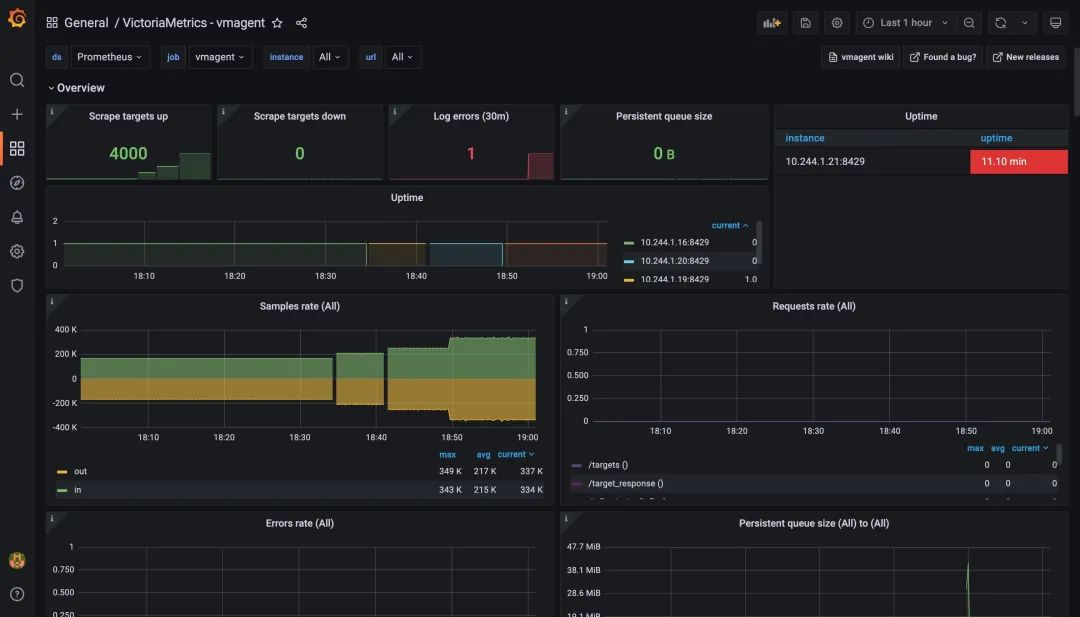
The graph below shows the monitoring chart for vmagent, from the chart you can see that the metrics target for the crawl is now 2000, which is consistent with the above configuration, and no one has any errors, proving that vmagent is still within the pressure range.
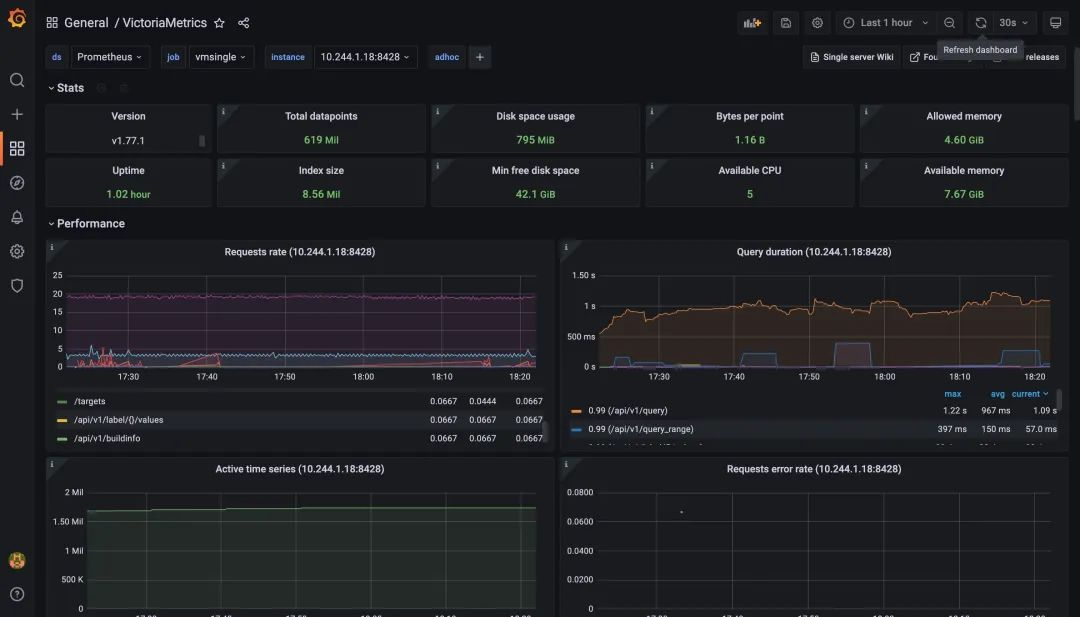
We can also look at the monitoring charts for VictoriaMetrics, a single-node remote storage, and see that it is currently working properly and has over a million active time series.
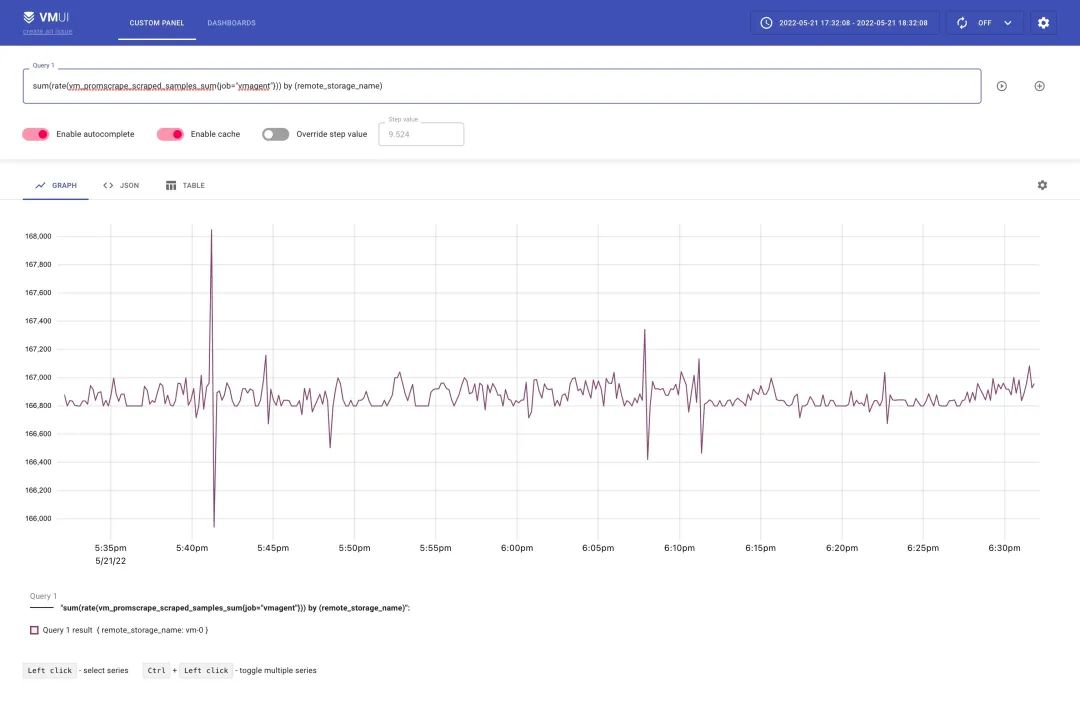
In addition to the above monitoring charts to see the results of the stress test, we can also go through some of the indicators below to verify that the stress level has been reached.
1
|
sum(rate(vm_promscrape_scraped_samples_sum{job="vmagent"})) by (remote_storage_name)
|
- Number of packets discarded when sending packets to the configured remote store. If the value is greater than zero, the remote store rejects the incoming data. In this case, it is recommended to check the remote storage logs and vmagent logs.
1
|
sum(rate(vmagent_remotewrite_packets_dropped_total{job="vmagent"})) by (remote_storage_name)
|
- The number of retries when sending data to the remote storage. If this value is greater than zero, then this indicates that the remote storage is unable to handle the workload. In this case, it is recommended to check the remote storage logs and vmagent logs.
1
|
sum(rate(vmagent_remotewrite_retries_count_total{job="vmagent"})) by (remote_storage_name)
|
- The amount of pending data that has not yet been sent to the remote storage on the vmagent side. If the graph grows, the remote storage cannot keep up with the given data ingestion rate. You can try adding
writeConcurrency to chart/values.yaml, which may help if there is high network latency between the vmagent of the prometheus benchmark.
1
|
sum(vm_persistentqueue_bytes_pending{job="vmagent"}) by (remote_storage_name)
|
- The number of errors when executing queries from
chart/files/alerts.yaml. If this value is greater than zero, the remote storage is unable to handle the query workload. In this case, it is recommended to check the remote storage logs and vmalert logs.
1
|
sum(rate(vmalert_execution_errors_total{job="vmalert"})) by (remote_storage_name)
|
These metrics can be queried by executing the make monitor command.
1
2
3
4
|
$ make monitor
kubectl port-forward `kubectl -n default get pods -n default -l 'job=vmsingle,chart-name=my-bench-prometheus-benchmark' -o name` 8428
Forwarding from 127.0.0.1:8428 -> 8428
Forwarding from [::1]:8428 -> 8428
|
The above indicator can then be verified by visiting http://127.0.0.1:8428/vmui in your browser as follows.
From our testing here 2000 crawl targets does not reach the upper limit, so we can continue to increase the value for testing, for example to 2500, and if the components are still working properly, then increase it to 3000 and continue testing.
For example, I tested 4000 crawled directories here, which means 800 metrics-per-target * 4k targets / 10s = 320k samples/s still works fine, so it seems that VictoriaMetrics’ official claim that single-node mode can support one million samples per second is still relatively reliable.
The test can be terminated by using the following command.
Summary
When comparing different solutions or different versions of the same solution by stress testing the data accepted by the Prometheus remote_write protocol, we should be able to draw a general conclusion. For example, how do solutions such as Prometheus itself, Cortex, Thanos, M3DB and TimescaleDB perform, but we always recommend not to simply trust these benchmarks, but to verify the amount of production data and resource usage.