We mentioned earlier the monolithic and read-write separation modes of Loki deployment, and when your daily log size exceeds terabytes, then we may need to use the microservice mode to deploy Loki.
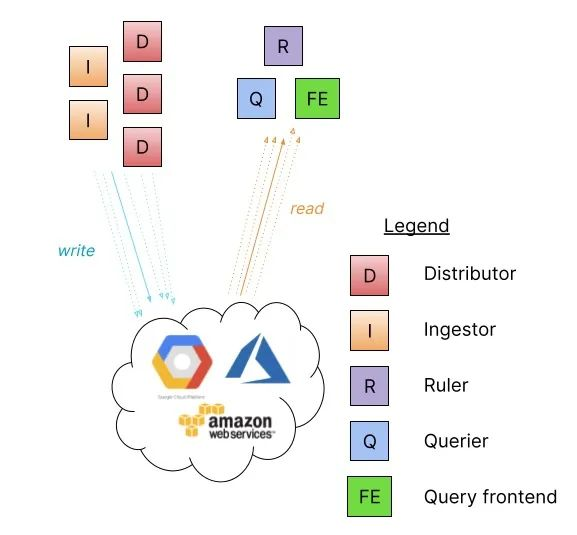
The microservice deployment pattern instantiates Loki’s components as distinct processes, each of which is invoked and assigned a target, and each of which generates a gRPC server for internal requests and an HTTP service for external API requests.
- ingester
- distributor
- query-frontend
- query-scheduler
- querier
- index-gateway
- ruler
- compactor
Running components as separate microservices allows scaling by increasing the number of microservices, and custom clusters have better observability of individual components. Microservice mode deployments are the most efficient Loki installations, however, they are also the most complex to set up and maintain.
Microservice mode is recommended for very large Loki clusters or clusters that require more control over scaling and cluster operations.
The microservices model is best suited for deployment in Kubernetes clusters and offers both Jsonnet and Helm Chart installations.
Helm Chart
Again, we will use Helm Chart to install Loki in microservice mode, but remember to remove the Loki-related services installed in the previous section before installing.
First get the Chart package for the microservice model.
1
2
3
|
$ helm repo add grafana https://grafana.github.io/helm-charts
$ helm pull grafana/loki-distributed --untar --version 0.48.4
$ cd loki-simple-scalable
|
The Chart package supports the components shown in the table below. The Ingester, distributor, querier, and query-frontend components are always installed, and the other components are optional.
| Component |
Optional |
Default on? |
| gateway |
✅ |
✅ |
| ingester |
❎ |
n/a |
| distributor |
❎ |
n/a |
| querier |
❎ |
n/a |
| query-frontend |
❎ |
n/a |
| table-manager |
✅ |
❎ |
| compactor |
✅ |
❎ |
| ruler |
✅ |
❎ |
| index-gateway |
✅ |
❎ |
| memcached-chunks |
✅ |
❎ |
| memcached-frontend |
✅ |
❎ |
| memcached-index-queries |
✅ |
❎ |
| memcached-index-writes |
✅ |
❎ |
This Chart package configures Loki in microservice mode, has been tested and can be used with boltdb-shipper and memberlist, while other storage and discovery options are also available, however, the chart does not support setting up Consul or Etcd for discovery, they need to be configured separately, instead, you can use memberlist which does not require Instead, you can use memberlist that does not require a separate key/value store. By default the Chart package creates a Headless Service for the member list, of which the ingester, distributor, querier and ruler are part.
Install minio
For example, we are using memberlist, boltdb-shipper and minio for storage here, and since this Chart package does not include minio, we need to install minio separately first.
1
2
3
|
$ helm repo add minio https://helm.min.io/
$ helm pull minio/minio --untar --version 8.0.10
$ cd minio
|
Create a values file as follows.
 1
 2
 3
 4
 5
 6
 7
 8
 9
10
11
12
13
14
15
16
17
18
|
# ci/loki-values.yaml
accessKey: "myaccessKey"
secretKey: "mysecretKey"

persistence:
  enabled: true
  storageClass: "local-path"
  accessMode: ReadWriteOnce
  size: 5Gi

service:
  type: NodePort
  port: 9000
  nodePort: 32000

resources:
  requests:
    memory: 1Gi
|
Install minio directly using the values file configured above.
 1
 2
 3
 4
 5
 6
 7
 8
 9
10
11
12
13
14
15
16
17
18
19
20
21
22
23
24
25
26
27
28
29
30
31
|
$ helm upgrade --install minio -n logging -f ci/loki-values.yaml .
Release "minio" does not exist. Installing it now.
NAME: minio
LAST DEPLOYED: Sun Jun 19 16:56:28 2022
NAMESPACE: logging
STATUS: deployed
REVISION: 1
TEST SUITE: None
NOTES:
Minio can be accessed via port 9000 on the following DNS name from within your cluster:
minio.logging.svc.cluster.local

To access Minio from localhost, run the below commands:

  1. export POD_NAME=$(kubectl get pods --namespace logging -l "release=minio" -o jsonpath="{.items[0].metadata.name}")

  2. kubectl port-forward $POD_NAME 9000 --namespace logging

Read more about port forwarding here: http://kubernetes.io/docs/user-guide/kubectl/kubectl_port-forward/

You can now access Minio server on http://localhost:9000. Follow the below steps to connect to Minio server with mc client:

  1. Download the Minio mc client - https://docs.minio.io/docs/minio-client-quickstart-guide

  2. Get the ACCESS_KEY=$(kubectl get secret minio -o jsonpath="{.data.accesskey}" | base64 --decode) and the SECRET_KEY=$(kubectl get secret minio -o jsonpath="{.data.secretkey}" | base64 --decode)

  3. mc alias set minio-local http://localhost:9000 "$ACCESS_KEY" "$SECRET_KEY" --api s3v4

  4. mc ls minio-local

Alternately, you can use your browser or the Minio SDK to access the server - https://docs.minio.io/categories/17
|
Check the status of the corresponding Pod after the installation is complete.
1
2
3
4
5
6
|
$ kubectl get pods -n logging
NAME                     READY   STATUS    RESTARTS   AGE
minio-548656f786-gctk9   1/1     Running   0          2m45s
$ kubectl get svc -n logging
NAME    TYPE       CLUSTER-IP      EXTERNAL-IP   PORT(S)          AGE
minio   NodePort   10.111.58.196   <none>        9000:32000/TCP   3h16m
|
You can access minio through the specified 32000 port.
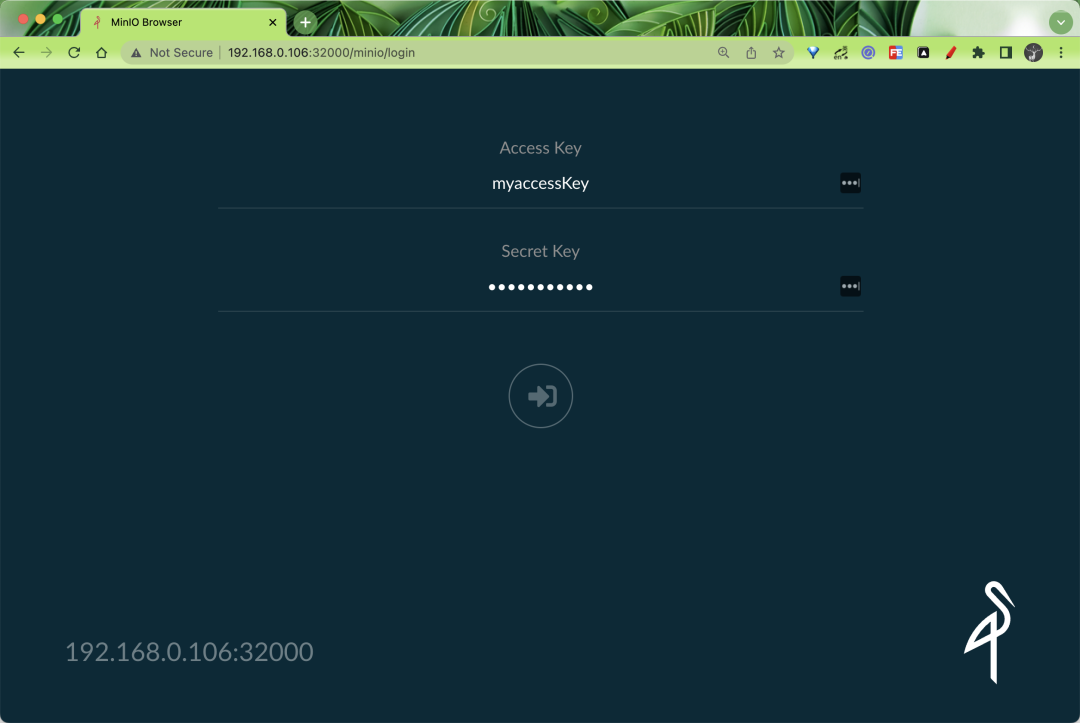
Then remember to create a bucket named loki-data.
Installing Loki
Now that we have our object store ready, let’s install Loki in microservices mode by first creating a values file as shown below.
 1
 2
 3
 4
 5
 6
 7
 8
 9
10
11
12
13
14
15
16
17
18
19
20
21
22
23
24
25
26
27
28
29
30
31
32
33
34
35
36
37
38
39
40
41
42
43
44
45
46
47
48
49
50
51
52
53
54
|
# ci/minio-values.yaml
loki:
  structuredConfig:
    ingester:
      max_transfer_retries: 0
      chunk_idle_period: 1h
      chunk_target_size: 1536000
      max_chunk_age: 1h
    storage_config:
      aws:
        endpoint: minio.logging.svc.cluster.local:9000
        insecure: true
        bucketnames: loki-data
        access_key_id: myaccessKey
        secret_access_key: mysecretKey
        s3forcepathstyle: true
      boltdb_shipper:
        shared_store: s3
    schema_config:
      configs:
        - from: 2022-06-21
          store: boltdb-shipper
          object_store: s3
          schema: v12
          index:
            prefix: loki_index_
            period: 24h

distributor:
  replicas: 2

ingester:
  replicas: 2
  persistence:
    enabled: true
    size: 1Gi
    storageClass: local-path

querier:
  replicas: 2
  persistence:
    enabled: true
    size: 1Gi
    storageClass: local-path

queryFrontend:
  replicas: 2

gateway:
  nginxConfig:
    httpSnippet: |-
            client_max_body_size 100M;
    serverSnippet: |-
            client_max_body_size 100M;
|
The above configuration optionally overrides the default values in the loki.config template file, and most configuration parameters can be set externally using loki.structuredConfig. loki.config, loki.schemaConfig and loki.storageConfig can also be used in conjunction with loki.structuredConfig. The values in loki.structuredConfig have a higher priority.
Here we specify the minio configuration for storing data via loki.structuredConfig.storage_config.aws. For high availability, we have 2 copies of the core components, ingester and querier for persistent storage.
Now use the values file above for a one-click installation.
 1
 2
 3
 4
 5
 6
 7
 8
 9
10
11
12
13
14
15
16
17
18
19
20
21
|
$ helm upgrade --install loki -n logging -f ci/minio-values.yaml .
Release "loki" does not exist. Installing it now.
NAME: loki
LAST DEPLOYED: Tue Jun 21 16:20:10 2022
NAMESPACE: logging
STATUS: deployed
REVISION: 1
TEST SUITE: None
NOTES:
***********************************************************************
 Welcome to Grafana Loki
 Chart version: 0.48.4
 Loki version: 2.5.0
***********************************************************************

Installed components:
* gateway
* ingester
* distributor
* querier
* query-frontend
|
The above will install several components separately: gateway, ingester, distributor, querier, query-frontend, and the corresponding Pod states are shown below.
 1
 2
 3
 4
 5
 6
 7
 8
 9
10
11
12
13
14
15
16
17
18
19
20
21
22
23
|
$ kubectl get pods -n logging
NAME                                                    READY   STATUS    RESTARTS       AGE
loki-loki-distributed-distributor-5dfdd5bd78-nxdq8      1/1     Running   0              2m40s
loki-loki-distributed-distributor-5dfdd5bd78-rh4gz      1/1     Running   0              116s
loki-loki-distributed-gateway-6f4cfd898c-hpszv          1/1     Running   0              21m
loki-loki-distributed-ingester-0                        1/1     Running   0              96s
loki-loki-distributed-ingester-1                        1/1     Running   0              2m38s
loki-loki-distributed-querier-0                         1/1     Running   0              2m2s
loki-loki-distributed-querier-1                         1/1     Running   0              2m33s
loki-loki-distributed-query-frontend-6d9845cb5b-p4vns   1/1     Running   0              4s
loki-loki-distributed-query-frontend-6d9845cb5b-sq5hr   1/1     Running   0              2m40s
minio-548656f786-gctk9                                  1/1     Running   1 (123m ago)   47h
$ kubectl get svc -n logging
NAME                                      TYPE        CLUSTER-IP       EXTERNAL-IP   PORT(S)                      AGE
loki-loki-distributed-distributor         ClusterIP   10.102.156.127   <none>        3100/TCP,9095/TCP            22m
loki-loki-distributed-gateway             ClusterIP   10.111.73.138    <none>        80/TCP                       22m
loki-loki-distributed-ingester            ClusterIP   10.98.238.236    <none>        3100/TCP,9095/TCP            22m
loki-loki-distributed-ingester-headless   ClusterIP   None             <none>        3100/TCP,9095/TCP            22m
loki-loki-distributed-memberlist          ClusterIP   None             <none>        7946/TCP                     22m
loki-loki-distributed-querier             ClusterIP   10.101.117.137   <none>        3100/TCP,9095/TCP            22m
loki-loki-distributed-querier-headless    ClusterIP   None             <none>        3100/TCP,9095/TCP            22m
loki-loki-distributed-query-frontend      ClusterIP   None             <none>        3100/TCP,9095/TCP,9096/TCP   22m
minio                                     NodePort    10.111.58.196    <none>        9000:32000/TCP               47h
|
The corresponding configuration file for Loki is shown below.
 1
 2
 3
 4
 5
 6
 7
 8
 9
10
11
12
13
14
15
16
17
18
19
20
21
22
23
24
25
26
27
28
29
30
31
32
33
34
35
36
37
38
39
40
41
42
43
44
45
46
47
48
49
50
51
52
53
54
55
56
57
58
59
60
61
62
63
64
65
66
67
68
69
70
71
72
73
74
75
76
77
78
79
80
81
82
83
84
85
86
87
88
89
90
91
92
93
94
95
|
$ kubectl get cm -n logging loki-loki-distributed -o yaml
apiVersion: v1
data:
  config.yaml: |
    auth_enabled: false
    chunk_store_config:
      max_look_back_period: 0s
    compactor:
      shared_store: filesystem
    distributor:
      ring:
        kvstore:
          store: memberlist
    frontend:
      compress_responses: true
      log_queries_longer_than: 5s
      tail_proxy_url: http://loki-loki-distributed-querier:3100
    frontend_worker:
      frontend_address: loki-loki-distributed-query-frontend:9095
    ingester:
      chunk_block_size: 262144
      chunk_encoding: snappy
      chunk_idle_period: 1h
      chunk_retain_period: 1m
      chunk_target_size: 1536000
      lifecycler:
        ring:
          kvstore:
            store: memberlist
          replication_factor: 1
      max_chunk_age: 1h
      max_transfer_retries: 0
      wal:
        dir: /var/loki/wal
    limits_config:
      enforce_metric_name: false
      max_cache_freshness_per_query: 10m
      reject_old_samples: true
      reject_old_samples_max_age: 168h
      split_queries_by_interval: 15m
    memberlist:
      join_members:
      - loki-loki-distributed-memberlist
    query_range:
      align_queries_with_step: true
      cache_results: true
      max_retries: 5
      results_cache:
        cache:
          enable_fifocache: true
          fifocache:
            max_size_items: 1024
            validity: 24h
    ruler:
      alertmanager_url: https://alertmanager.xx
      external_url: https://alertmanager.xx
      ring:
        kvstore:
          store: memberlist
      rule_path: /tmp/loki/scratch
      storage:
        local:
          directory: /etc/loki/rules
        type: local
    schema_config:
      configs:
      - from: "2022-06-21"
        index:
          period: 24h
          prefix: loki_index_
        object_store: s3
        schema: v12
        store: boltdb-shipper
    server:
      http_listen_port: 3100
    storage_config:
      aws:
        access_key_id: myaccessKey
        bucketnames: loki-data
        endpoint: minio.logging.svc.cluster.local:9000
        insecure: true
        s3forcepathstyle: true
        secret_access_key: mysecretKey
      boltdb_shipper:
        active_index_directory: /var/loki/index
        cache_location: /var/loki/cache
        cache_ttl: 168h
        shared_store: s3
      filesystem:
        directory: /var/loki/chunks
    table_manager:
      retention_deletes_enabled: false
      retention_period: 0s
kind: ConfigMap
# ......
|
There is also a gateway component that will help us route requests to the correct component, which is also an nginx service, and is configured as shown below.
 1
 2
 3
 4
 5
 6
 7
 8
 9
10
11
12
13
14
15
16
17
18
19
20
21
22
23
24
25
26
27
28
29
30
31
32
33
34
35
36
37
38
39
40
41
42
43
44
45
46
47
48
49
50
51
52
53
54
55
56
57
58
59
60
61
62
63
64
65
66
67
68
69
70
71
72
73
74
75
76
77
78
79
80
81
82
|
$ kubectl -n logging exec -it loki-loki-distributed-gateway-6f4cfd898c-hpszv -- cat /etc/nginx/nginx.conf
worker_processes  5;  ## Default: 1
error_log  /dev/stderr;
pid        /tmp/nginx.pid;
worker_rlimit_nofile 8192;

events {
  worker_connections  4096;  ## Default: 1024
}

http {
  client_body_temp_path /tmp/client_temp;
  proxy_temp_path       /tmp/proxy_temp_path;
  fastcgi_temp_path     /tmp/fastcgi_temp;
  uwsgi_temp_path       /tmp/uwsgi_temp;
  scgi_temp_path        /tmp/scgi_temp;

  default_type application/octet-stream;
  log_format   main '$remote_addr - $remote_user [$time_local]  $status '
        '"$request" $body_bytes_sent "$http_referer" '
        '"$http_user_agent" "$http_x_forwarded_for"';
  access_log   /dev/stderr  main;

  sendfile     on;
  tcp_nopush   on;
  resolver kube-dns.kube-system.svc.cluster.local;

  client_max_body_size 100M;

  server {
    listen             8080;

    location = / {
      return 200 'OK';
      auth_basic off;
    }

    location = /api/prom/push {
      proxy_pass       http://loki-loki-distributed-distributor.logging.svc.cluster.local:3100$request_uri;
    }

    location = /api/prom/tail {
      proxy_pass       http://loki-loki-distributed-querier.logging.svc.cluster.local:3100$request_uri;
      proxy_set_header Upgrade $http_upgrade;
      proxy_set_header Connection "upgrade";
    }

    # Ruler
    location ~ /prometheus/api/v1/alerts.* {
      proxy_pass       http://loki-loki-distributed-ruler.logging.svc.cluster.local:3100$request_uri;
    }
    location ~ /prometheus/api/v1/rules.* {
      proxy_pass       http://loki-loki-distributed-ruler.logging.svc.cluster.local:3100$request_uri;
    }
    location ~ /api/prom/rules.* {
      proxy_pass       http://loki-loki-distributed-ruler.logging.svc.cluster.local:3100$request_uri;
    }
    location ~ /api/prom/alerts.* {
      proxy_pass       http://loki-loki-distributed-ruler.logging.svc.cluster.local:3100$request_uri;
    }

    location ~ /api/prom/.* {
      proxy_pass       http://loki-loki-distributed-query-frontend.logging.svc.cluster.local:3100$request_uri;
    }

    location = /loki/api/v1/push {
      proxy_pass       http://loki-loki-distributed-distributor.logging.svc.cluster.local:3100$request_uri;
    }

    location = /loki/api/v1/tail {
      proxy_pass       http://loki-loki-distributed-querier.logging.svc.cluster.local:3100$request_uri;
      proxy_set_header Upgrade $http_upgrade;
      proxy_set_header Connection "upgrade";
    }

    location ~ /loki/api/.* {
      proxy_pass       http://loki-loki-distributed-query-frontend.logging.svc.cluster.local:3100$request_uri;
    }

    client_max_body_size 100M;
  }
}
|
The above configuration shows that the corresponding Push endpoints /api/prom/push and /loki/api/v1/push are forwarded to http://loki-loki-distributed-distributor.logging.svc.cluster.local:3100 $request_uri; , which is the corresponding distributor service.
1
2
3
4
|
$ kubectl get pods -n logging -l app.kubernetes.io/component=distributor,app.kubernetes.io/instance=loki,app.kubernetes.io/name=loki-distributed
NAME                                                 READY   STATUS    RESTARTS   AGE
loki-loki-distributed-distributor-5dfdd5bd78-nxdq8   1/1     Running   0          8m20s
loki-loki-distributed-distributor-5dfdd5bd78-rh4gz   1/1     Running   0          7m36s
|
So if we want to write log data, naturally we are now writing to the Push endpoint of the gateway. To verify that the application is working, next we install Promtail and Grafana to read and write the data.
Install Promtail
Get the promtail Chart package and unzip it.
1
2
|
$ helm pull grafana/promtail --untar
$ cd promtail
|
Create a values file as follows.
1
2
3
4
5
6
|
# ci/minio-values.yaml
rbac:
  pspEnabled: false
config:
  clients:
    - url: http://loki-loki-distributed-gateway/loki/api/v1/push
|
Note that we need to configure the Loki address in Promtail to be http://loki-loki-distributed-gateway/loki/api/v1/push, so that Promtail sends the log data to the gateway first, and then the gateway forwards it to the write node based on our Endpoints to forward to the write node, using the values file above to install Promtail.
 1
 2
 3
 4
 5
 6
 7
 8
 9
10
11
12
13
14
15
16
17
18
19
|
$ helm upgrade --install promtail -n logging -f ci/minio-values.yaml .
Release "promtail" does not exist. Installing it now.
NAME: promtail
LAST DEPLOYED: Tue Jun 21 16:31:34 2022
NAMESPACE: logging
STATUS: deployed
REVISION: 1
TEST SUITE: None
NOTES:
***********************************************************************
 Welcome to Grafana Promtail
 Chart version: 5.1.0
 Promtail version: 2.5.0
***********************************************************************

Verify the application is working by running these commands:

* kubectl --namespace logging port-forward daemonset/promtail 3101
* curl http://127.0.0.1:3101/metrics
|
A promtail will be run on each node after a normal installation.
1
2
3
4
5
|
$ kubectl get pods -n logging -l app.kubernetes.io/name=promtail
NAME             READY   STATUS    RESTARTS   AGE
promtail-gbjzs   1/1     Running   0          38s
promtail-gjn5p   1/1     Running   0          38s
promtail-z6vhd   1/1     Running   0          38s
|
Normal promtail is already collecting all the container logs on the node, and then pushing the log data to the gateway, which forwards it to the write node, where we can view the gateway logs.
1
2
3
4
5
6
|
$ kubectl logs -f loki-loki-distributed-gateway-6f4cfd898c-hpszv -n logging
10.244.2.26 - - [21/Jun/2022:08:41:24 +0000]  204 "POST /loki/api/v1/push HTTP/1.1" 0 "-" "promtail/2.5.0" "-"
10.244.2.1 - - [21/Jun/2022:08:41:24 +0000]  200 "GET / HTTP/1.1" 2 "-" "kube-probe/1.22" "-"
10.244.2.26 - - [21/Jun/2022:08:41:25 +0000]  204 "POST /loki/api/v1/push HTTP/1.1" 0 "-" "promtail/2.5.0" "-"
10.244.1.28 - - [21/Jun/2022:08:41:26 +0000]  204 "POST /loki/api/v1/push HTTP/1.1" 0 "-" "promtail/2.5.0" "-"
......
|
You can see that the gateway is now receiving requests directly from /loki/api/v1/push, which is what promtail is sending. Normally, the log data is now distributed to the write node, which stores it in minio, so you can check to see if there is already log data in minio. The minio service was assigned a NodePort of 32000 during the previous installation.
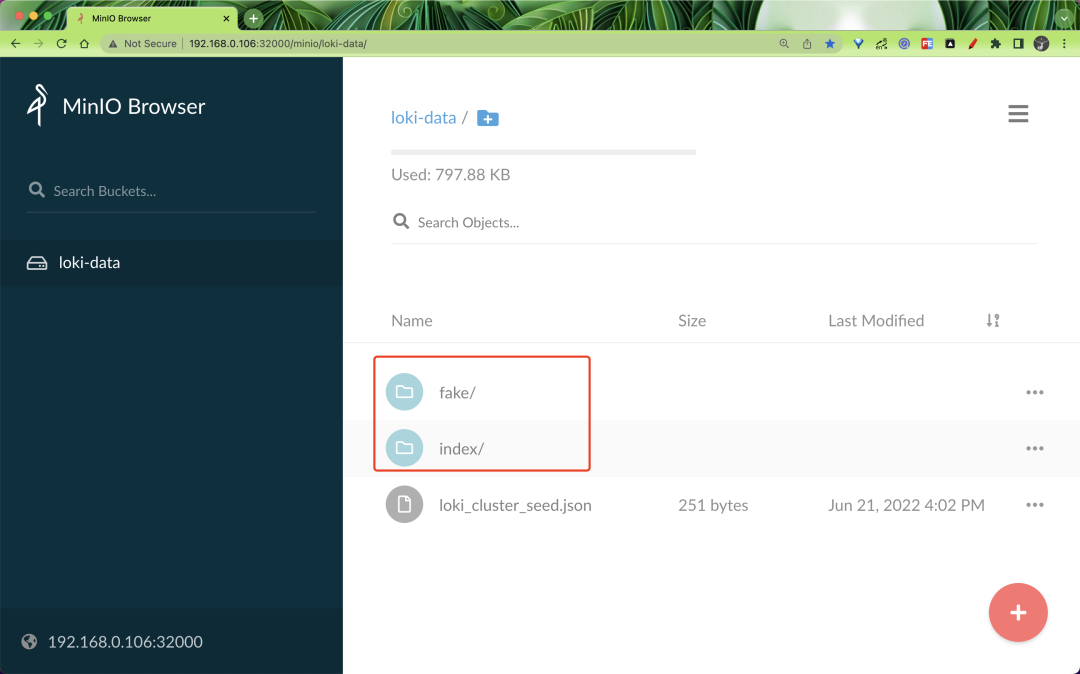
Here you can see that the data is ready to be written properly.
Installing Grafana
Let’s verify the read path, install Grafana and interface to Loki.
1
2
|
$ helm pull grafana/grafana --untar
$ cd grafana
|
Create the values configuration file as follows.
 1
 2
 3
 4
 5
 6
 7
 8
 9
10
11
12
|
# ci/minio-values.yaml
service:
  type: NodePort
  nodePort: 32001
rbac:
  pspEnabled: false
persistence:
  enabled: true
  storageClassName: local-path
  accessModes:
    - ReadWriteOnce
  size: 1Gi
|
Install Grafana directly using the values file above.
 1
 2
 3
 4
 5
 6
 7
 8
 9
10
11
12
13
14
15
16
17
18
19
20
21
22
23
|
$ helm upgrade --install grafana -n logging -f ci/minio-values.yaml .
Release "grafana" does not exist. Installing it now.
NAME: grafana
LAST DEPLOYED: Tue Jun 21 16:47:54 2022
NAMESPACE: logging
STATUS: deployed
REVISION: 1
NOTES:
1. Get your 'admin' user password by running:

   kubectl get secret --namespace logging grafana -o jsonpath="{.data.admin-password}" | base64 --decode ; echo

2. The Grafana server can be accessed via port 80 on the following DNS name from within your cluster:

   grafana.logging.svc.cluster.local

   Get the Grafana URL to visit by running these commands in the same shell:
export NODE_PORT=$(kubectl get --namespace logging -o jsonpath="{.spec.ports[0].nodePort}" services grafana)
     export NODE_IP=$(kubectl get nodes --namespace logging -o jsonpath="{.items[0].status.addresses[0].address}")
     echo http://$NODE_IP:$NODE_PORT


3. Login with the password from step 1 and the username: admin
|
The login password can be obtained by using the command in the prompt above.
1
|
$ kubectl get secret --namespace logging grafana -o jsonpath="{.data.admin-password}" | base64 --decode ; echo
|
Then log in to Grafana using the password and admin username above.
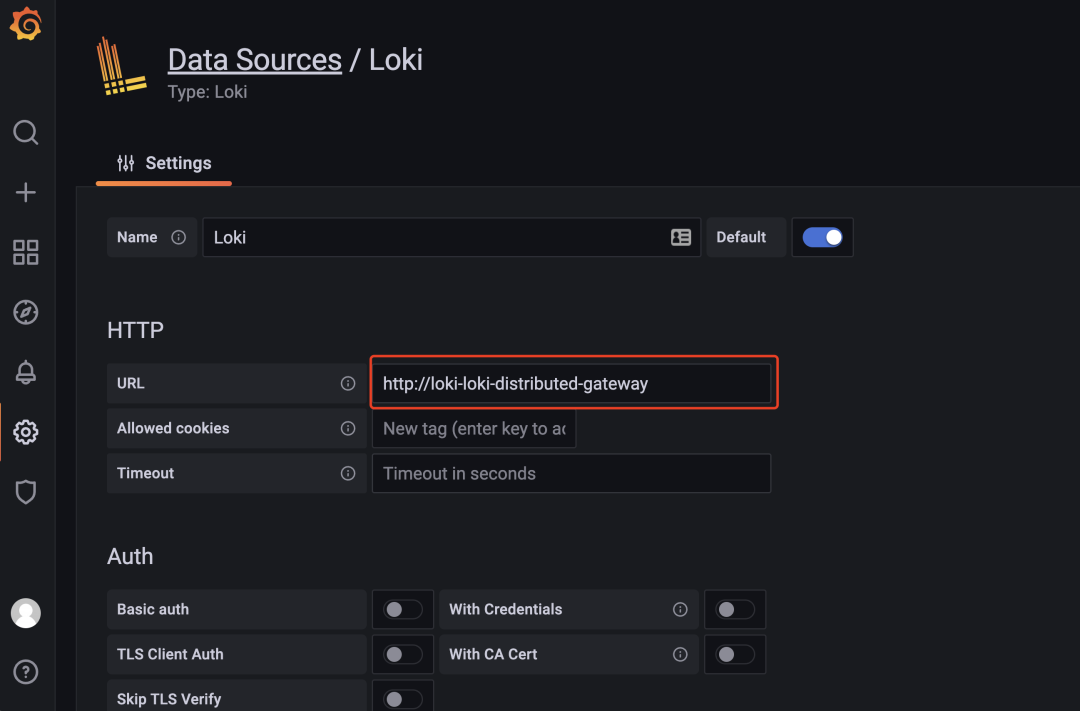
After logging in, go to Grafana and add a data source. Here you need to fill in the gateway address http://loki-loki-distributed-gateway.
After saving the data source, you can go to the Explore page to filter the logs, for example, we are here to view the logs of the gateway application in real time, as shown in the following figure.
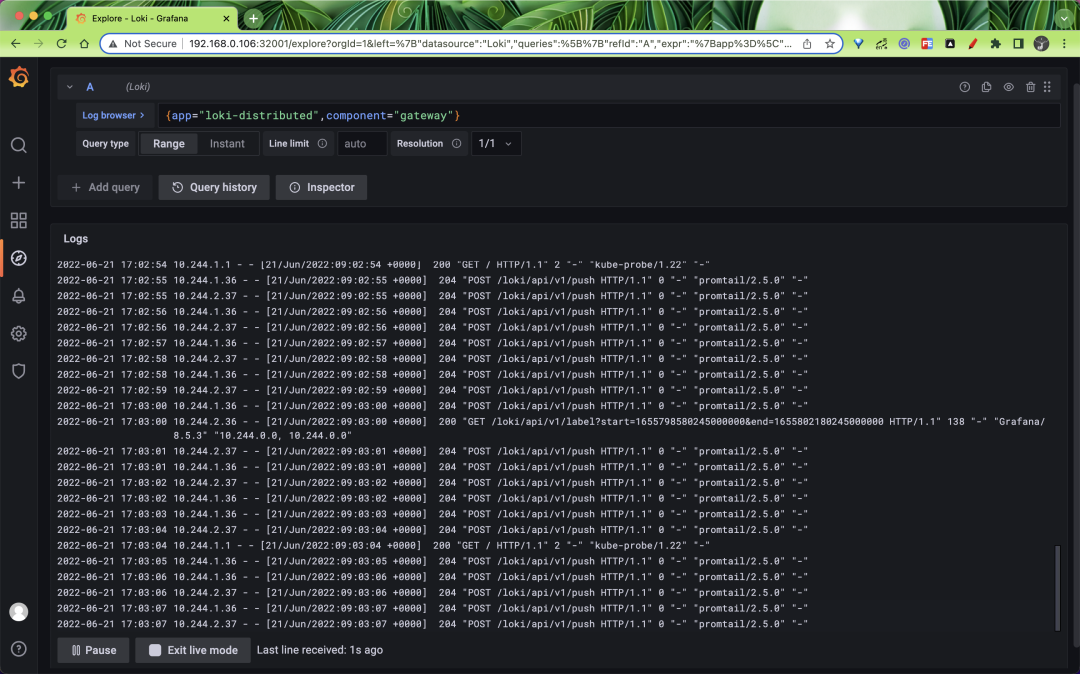
If you can see the latest log data, it means we have successfully deployed Loki in microservice mode, which is very flexible and can scale up and down different components as needed, but the cost of operation and maintenance will also increase a lot.
In addition, we can also do query and write caching. The Helm Chart we use here supports memcached, or you can switch to redis.